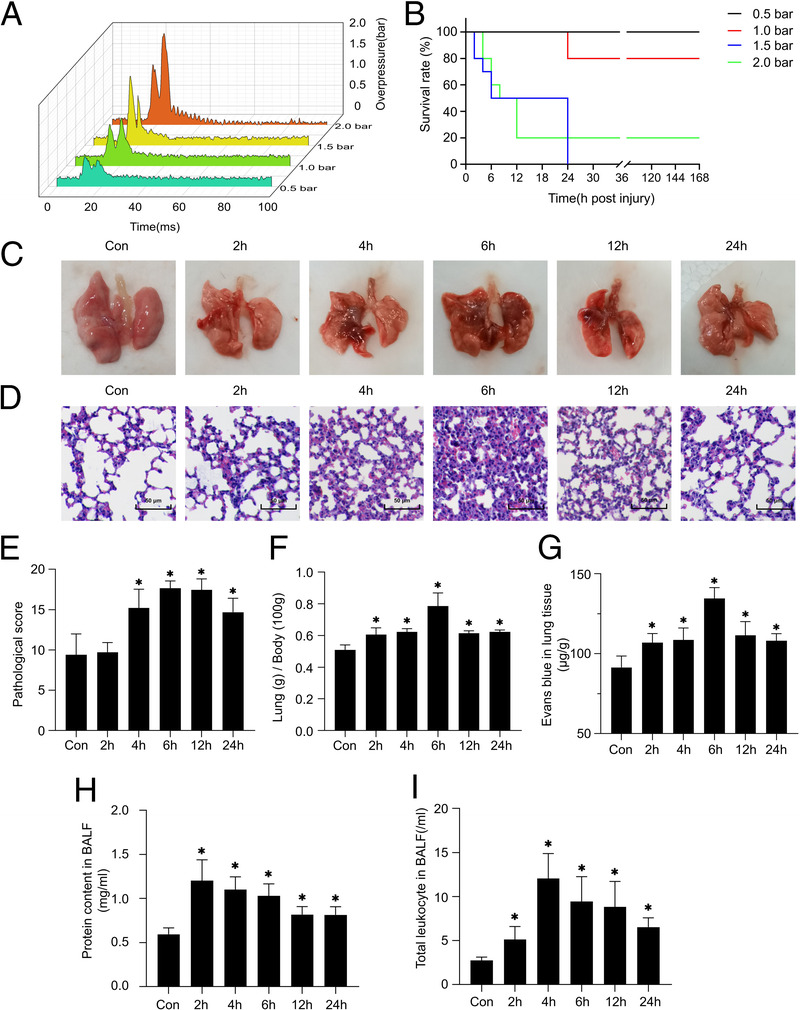
Figure 2.

Lung tissue damage in mice after explosion. (A) Diagram of the peak pressure of shock wave generated by the device changing with time (0.5–2.0 bar). (B) Survival analysis of the animals with blast injuries at different shock wave pressure (0.5–2.0 bar). (C) Gross observation of lung tissue. (D–E) H&E staining and pathological scores of lung tissues. (F) The lung coefficient in each group. (G) EBD leakage test to detect pulmonary vascular injury. (H–I) Total protein concentration and leukocyte in BALF. Results are presented as mean ± SD. *p < 0.05.
