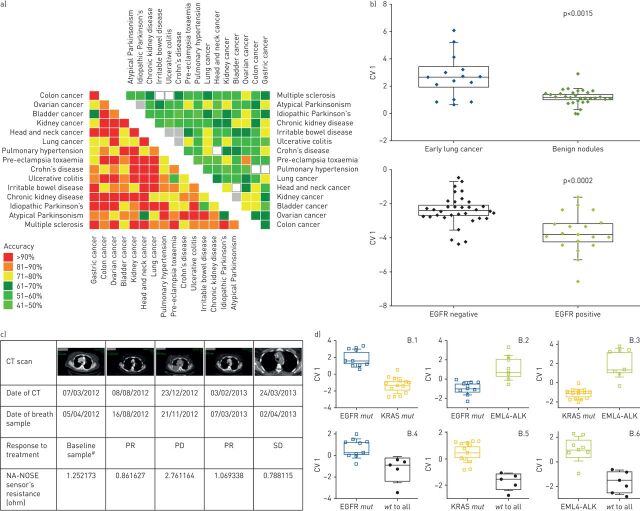
FIGURE 2.
Volatolomics in cancer. a) Discrimination between different cancers: graphical representation for the accuracies calculated of binary discriminant factor analysis (DFA) classifiers for disease classification by breath analysis. The left heat map gives comparisons between patients from each group, including eight cancers, resulting in an average of 86% accuracy. The right heat map represents a comparison of healthy volunteers from each group, resulting in a 58% accuracy. Reproduced and modified from [35] with permission. b) Cancer histology classification and staging: graphical representation of canonical variable (CV) values calculated from the responses of the sensor array to breath samples taken from lung cancer patients at early stages of the disease compared with benign nodules. A volatolomic signature was also calculated for the discrimination between lung cancer patients harbouring the epidermal growth factor receptor (EGFR) mutation and those without. Reproduced and modified from [4] with permission. c) Cancer monitoring: computed tomography (CT) scans from a lung cancer patient undergoing CT follow-up while receiving chemotherapy. Dates of CT scans, as well as of breath samples, are indicated. The corresponding sensor response in ohms is indicated with relation to each CT scan. PR: partial response; PD: progressive disease; SD: stable disease. #: before initiation of treatment. Reproduced and modified from [5] with permission. d) Genetic mutations in cancer: DFA maps calculated from signals obtained from sensor arrays to VOCs in the headspace samples of cell lines bearing different genetic mutations associated with lung cancer (EGFR, KRAS and echinoderm microtubule-associated protein-like 4 (EML4)–anaplastic lymphoma kinase (ALK) fusion). wt: wild type. Reproduced and modified from [46] with permission.

