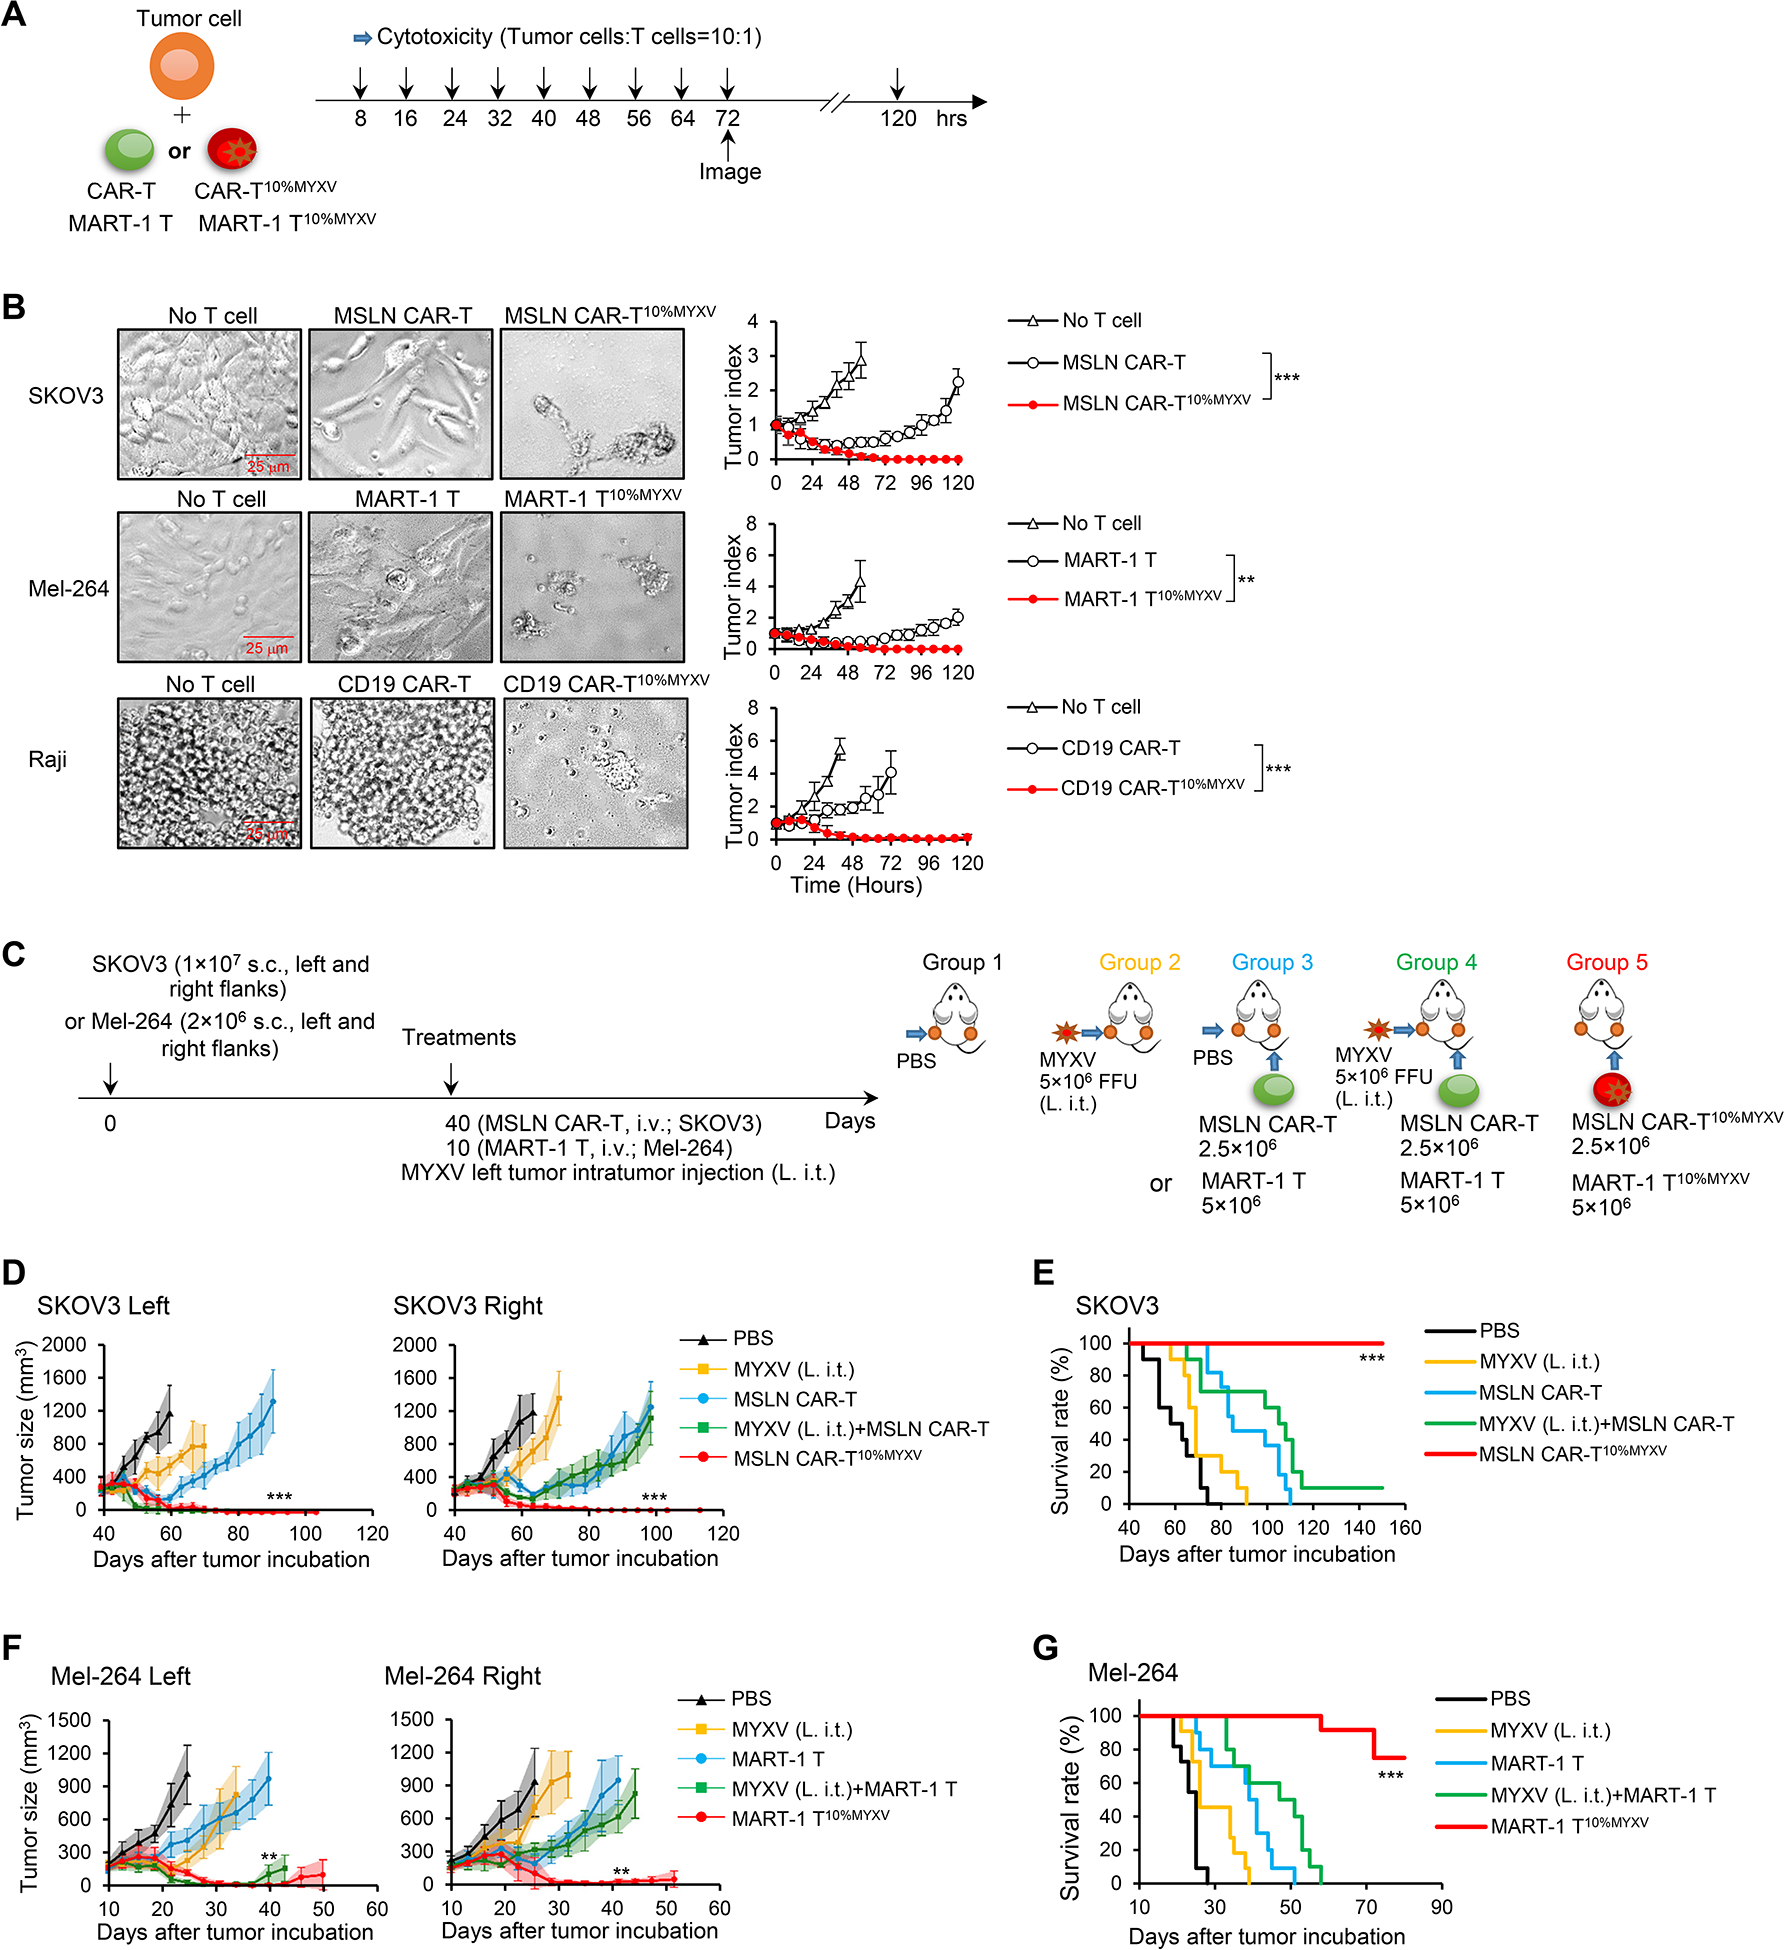
Figure 2. Tumor-specific T10%MYXV display strong antitumor efficacy.

(A-B) Schema of in vitro cytolytic assays. (A) Indicated T cells (2×10³) were cocultured with tumor cells (2×10⁴). Cytotoxic assays were performed every 8 hrs. (B) Representative images (72 hrs) and summarized tumor-killing are shown (n=3/time point). Data are mean ± SD. ***P<0.001, SKOV3; **P<0.01, Mel-264; ***P<0.001, Raji, two-way ANOVA with posthoc Holm-Sidak test. (C-G) Treatment schema is shown (C). NSG mice bearing 40-day established SKOV3 tumors were treated when tumors reached ~9×8 mm on day 40 (C-E); NSG mice bearing 10-day established Mel-264 tumors were treated when tumors reached ~7×6 mm on day 10 (C, F-G). In groups 1, 2, 3 and 4, PBS or MYXV was i.t. injected only into tumors on the left flanks (L. i.t.), and tumors on the right flanks did not receive i.t. injection. In groups 3 and 4, MSLN CAR-T or MART-1 T cells were i.v. injected. In group 5, MART-1 T10%MYXV or MSLN CAR-T10%MYXV cells were i.v. injected. Tumor responses to ACT with MSLN CAR-T10%MYXV (D) and MART-1 T10%MYXV cells (F) are shown (n=5/group). Data are mean ± SD. ***P<0.001, MSLN CAR-T10%MYXV compared with any other groups (D); **P<0.01, MART-1 T10%MYXV compared with any other groups (F), two-way ANOVA with posthoc Holm-Sidak test. (E, G) Survival curves from 2 independent studies are summarized (n=10–12/group). ***P<0.001, compared with any other groups, survival analysis was conducted by log-rank test. See also Figure S2.
