
Figure 5. Murine tumor-specific T10%MYXV ACT eradicates solid tumors with antigen heterogeneity.
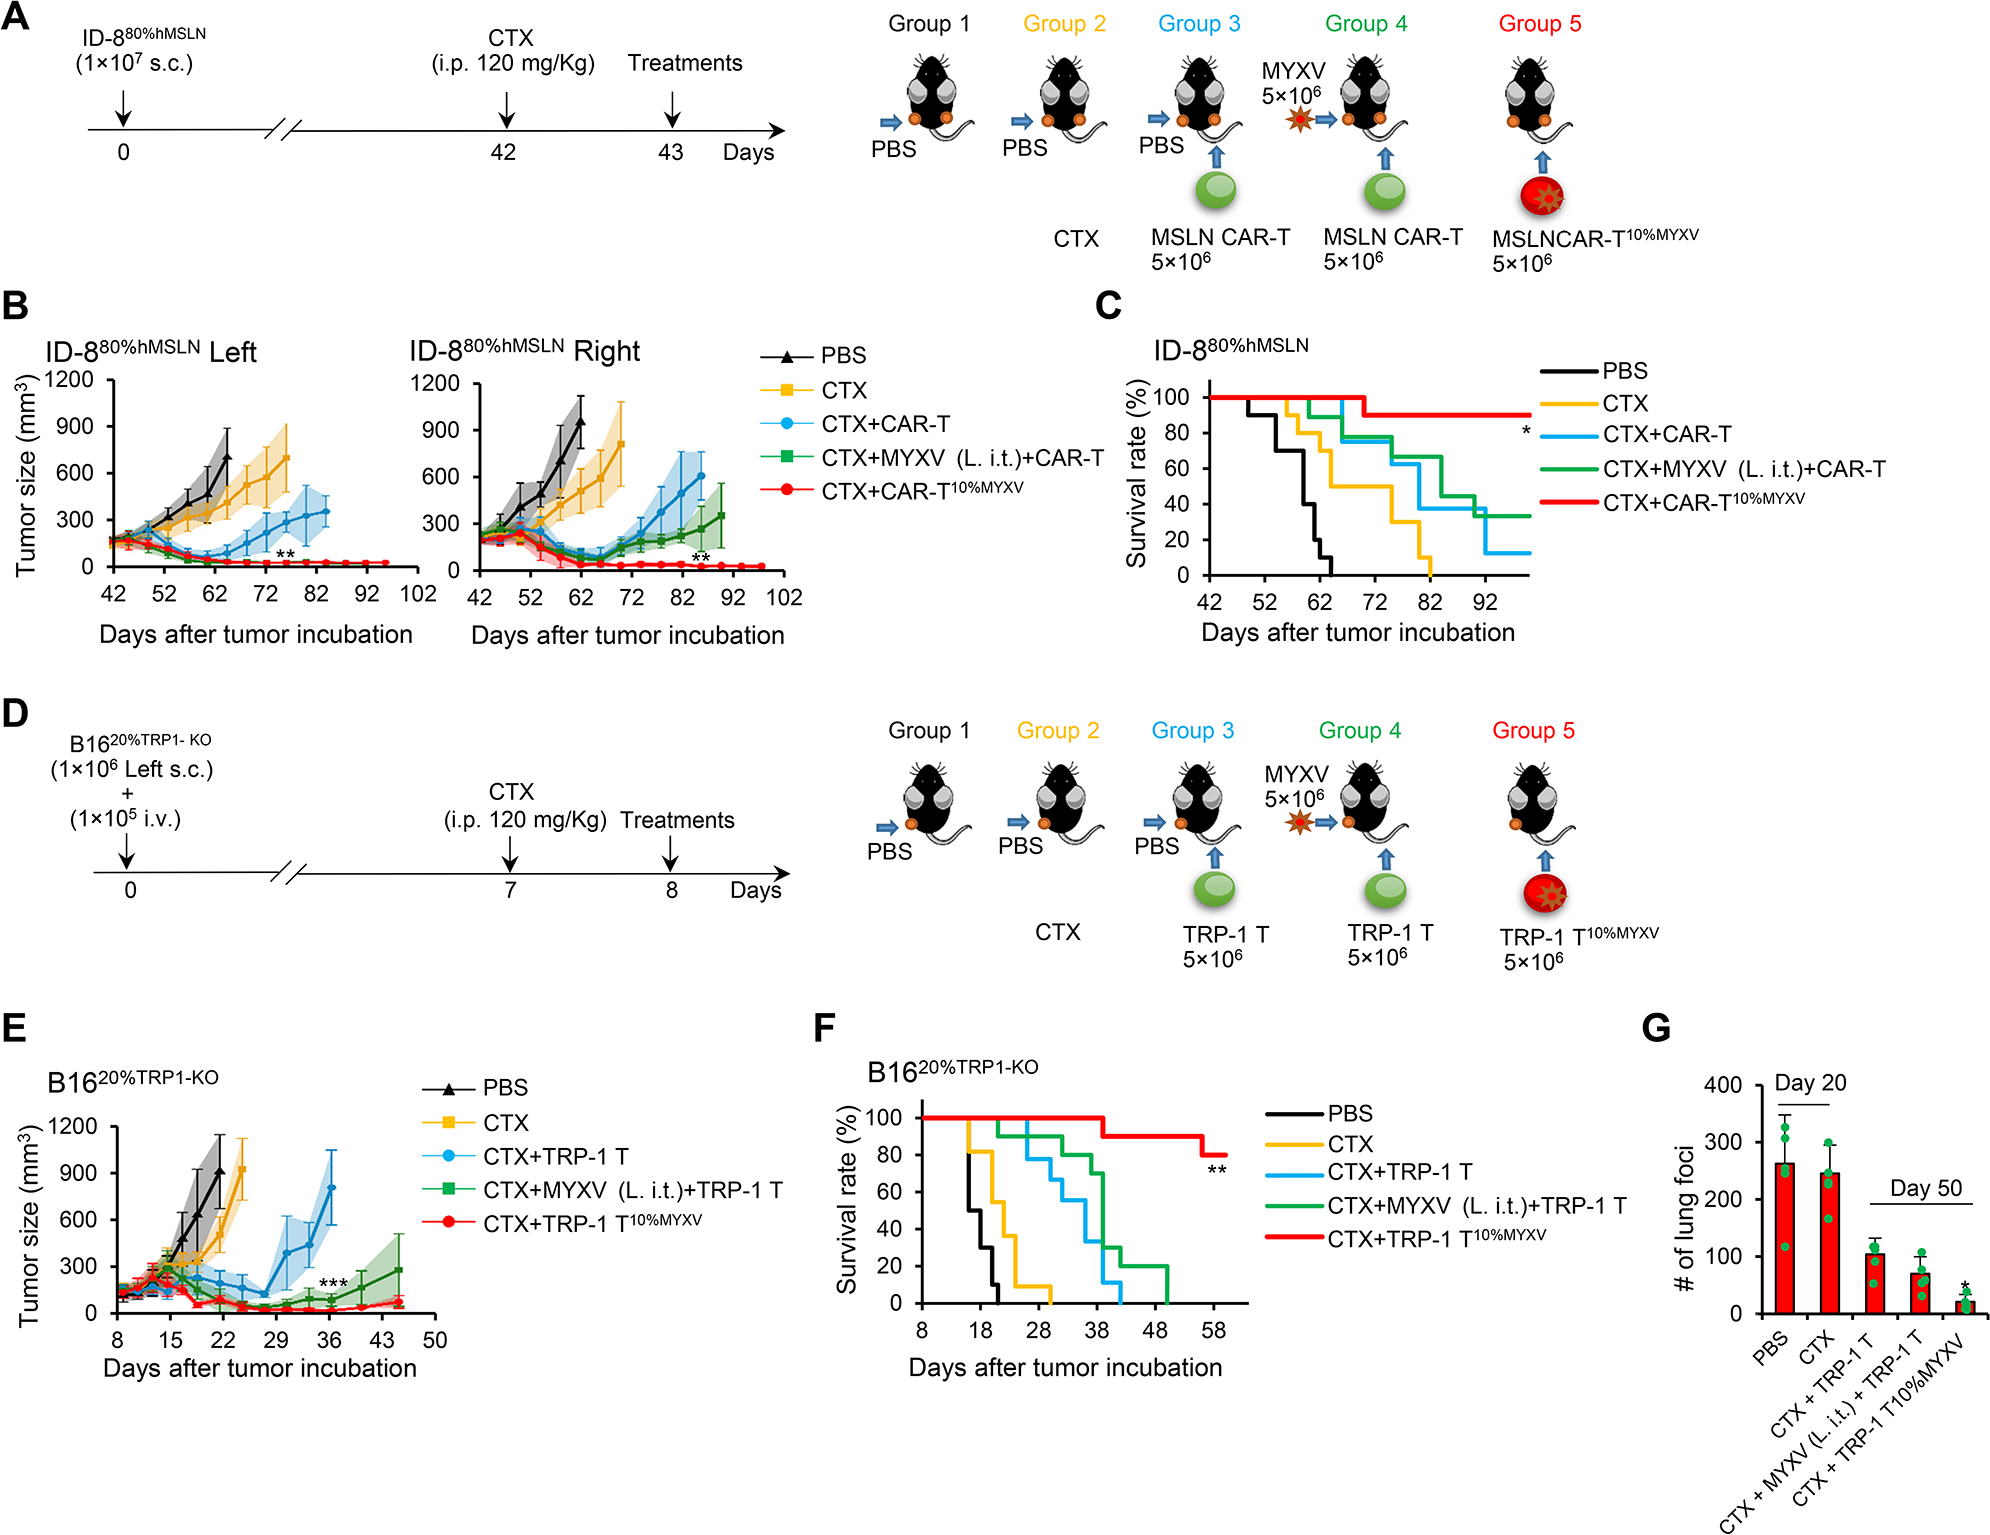
(A-C) Indicated treatments were given to B6 mice bearing s.c. established ID-880%hMSLN tumors on day 43 when tumors reached ~9×7 mm. (A) Treatment schema is shown. In groups 1, 2 and 3, PBS was i.t. injected only into tumors on the left flank (L. i.t.). In group 4, MYXV was i.t. injected only into tumors on the left flank (L. i.t.). In groups 3 and 4, MSLN CAR-T cells were i.v. injected. In group 5, MSLN CAR-T10%MYXV cells were i.v. injected. (B) Tumor responses are shown (n=5/group). Data are mean ± SD. **P<0.01, MSLN CAR-T10%MYXV compared with any other groups, two-way ANOVA with posthoc Holm-Sidak test. (C) Survival curves from two independent studies are summarized (n=8–10/group). *P<0.05, compared with any other groups, survival analysis was conducted by log-rank test. (D-G) B6 mice were inoculated s.c. with 1×10⁶ B1620%TRP−1-KO cells only on the left flank and injected i.v. with 1×10⁵ B1620%TRP−1-KO cells to induce lung metastatic tumors. Treatments were administrated on day 8 when s.c. tumors reached ~7×6 mm. (D) Treatment schema is shown. In groups 1, 2, and 3, PBS was i.t. injected only into tumors on the left flank (L. i.t.). In group 4, MYXV was i.t. injected only into tumors on the left flank (L. i.t.). In groups 3 and 4, TRP-1 T cells were i.v. injected. In group 5, TRP-1 T10%MYXV cells were i.v. injected. (E) Tumor responses are shown (n=5/group). Data are mean ± SD. ***P<0.001, TRP-1 T10%MYXV compared with TRP-1 T group, two-way ANOVA with posthoc Holm-Sidak test. (F) Survival curves from two independent studies are summarized (n=9–11/group). **P<0.01, compared with any other groups, survival analysis was conducted by log-rank test. (G) The counts of lung foci (n=5/group). Data are mean ± SD. *P<0.05, TRP-1 T10%MYXV compared with any other groups (Day 50), one-way ANOVA with Tukey test. See also Figure S5.