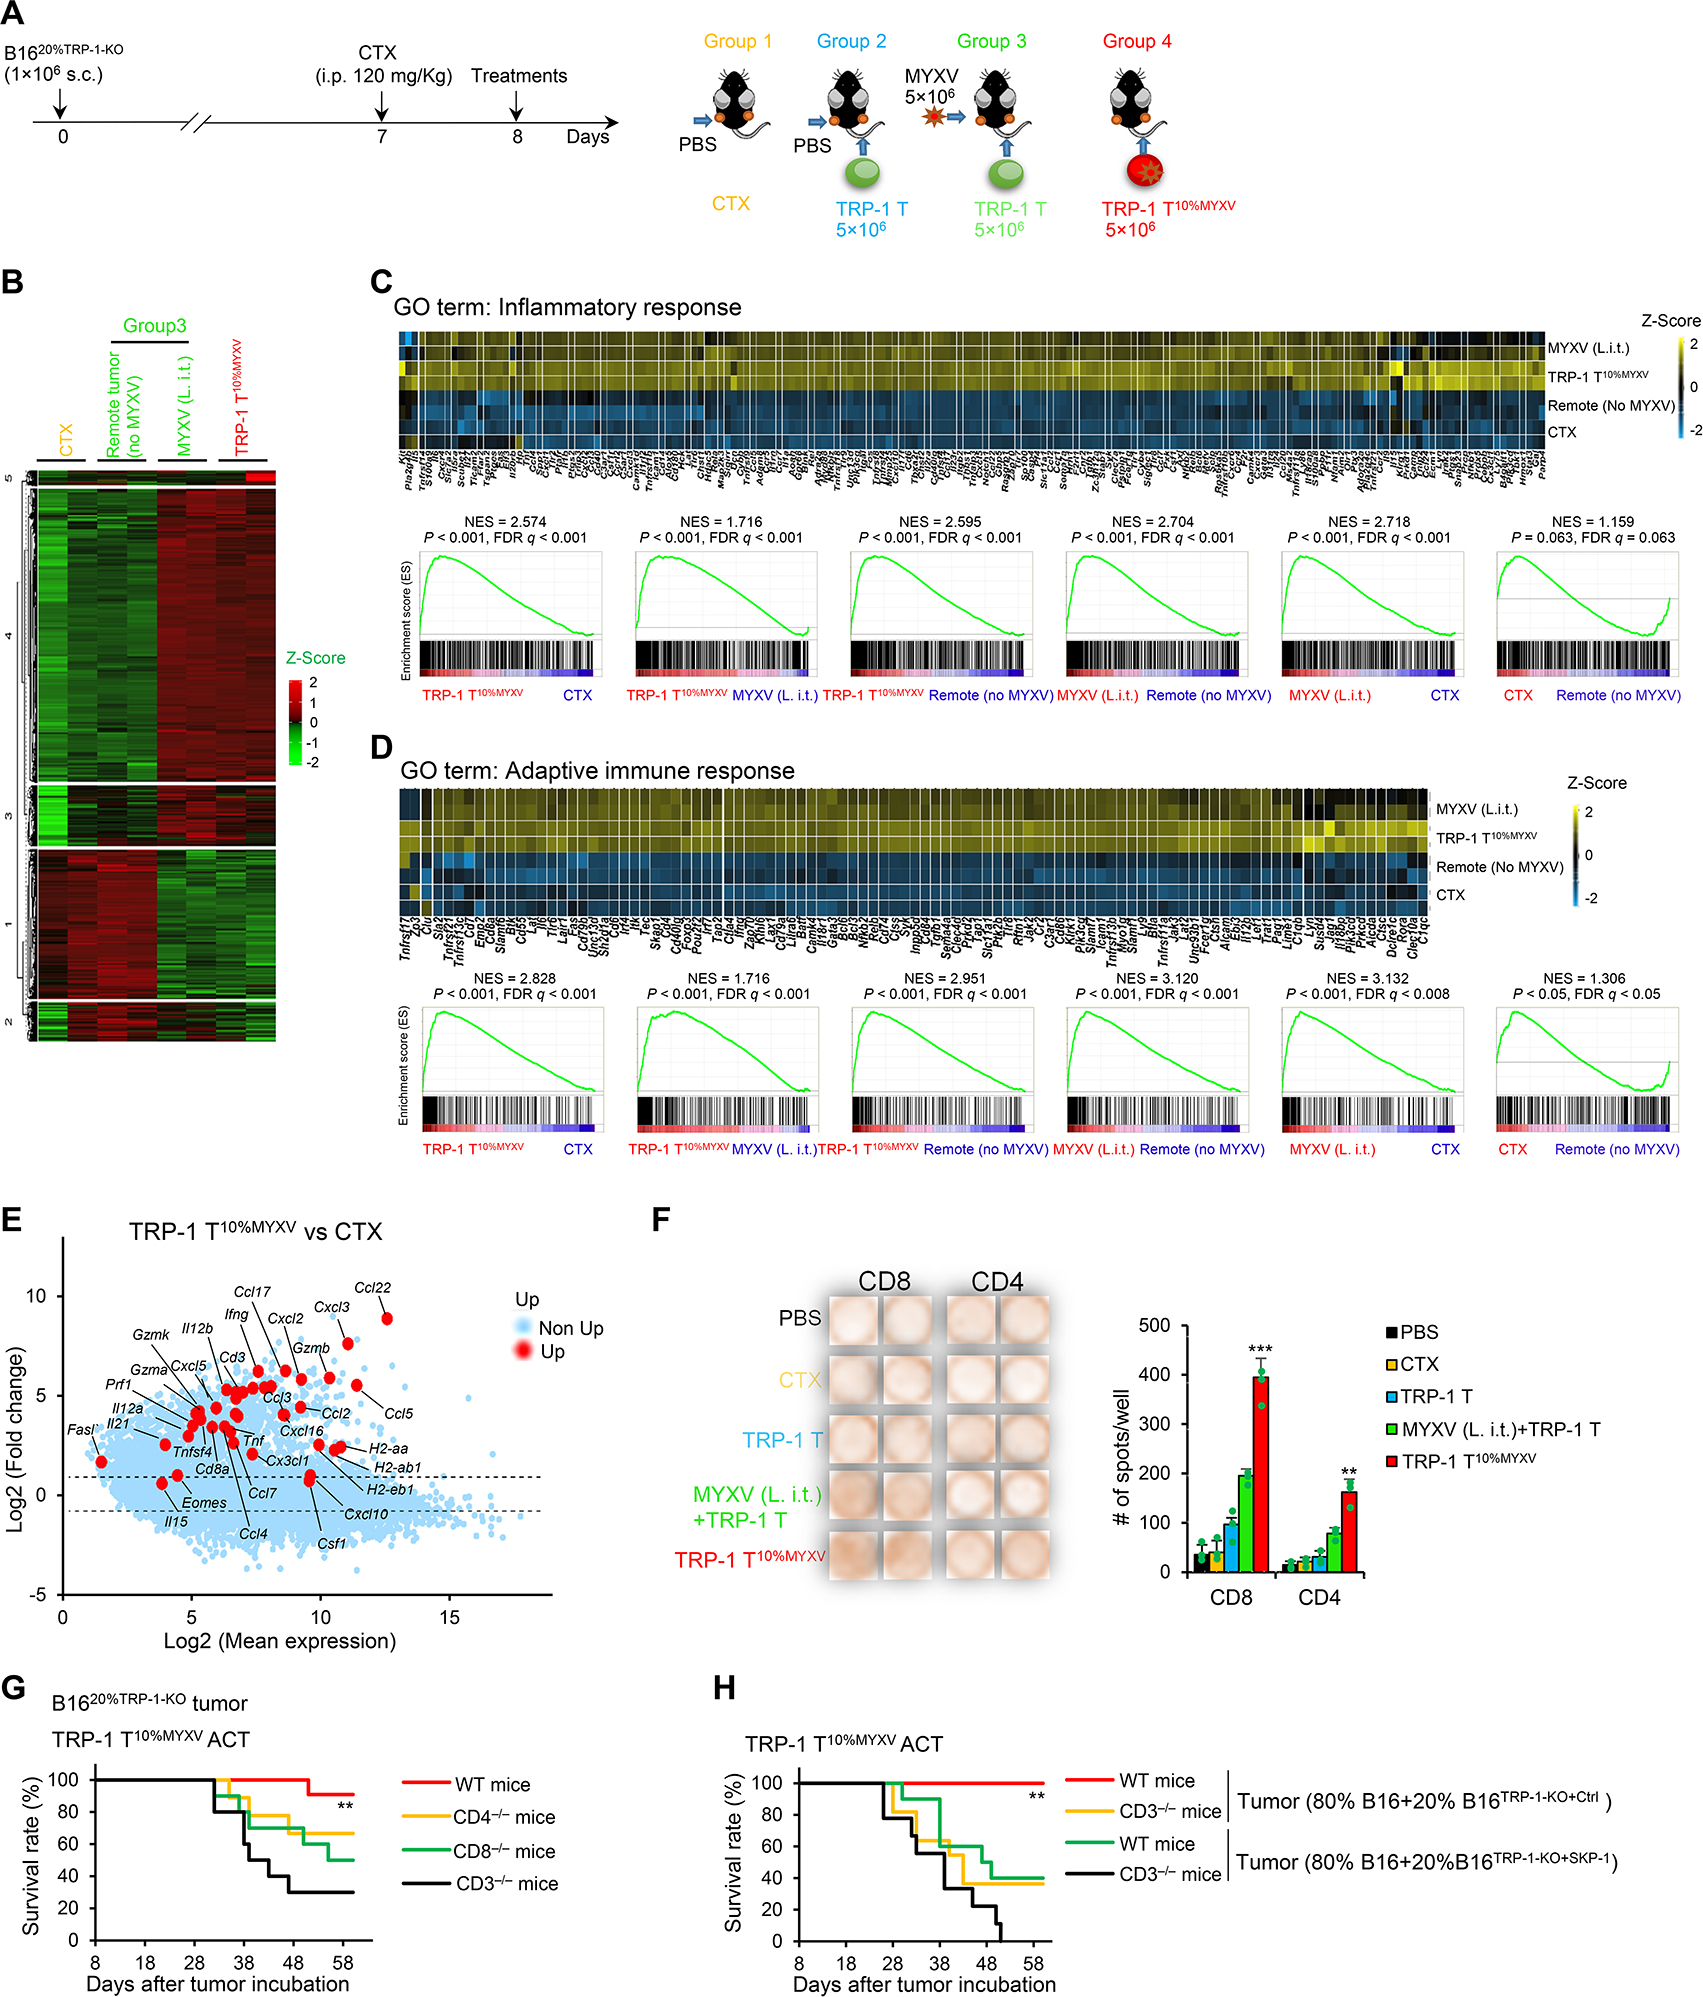
Figure 6. ACT with T10%MYXV induces a robust adaptive immunity to restrain ALVs.

(A-F) B1620%TRP−1-KO cells were s.c. injected into both flanks of the mice. Treatments were administrated on day 8 when tumors reached ~7×6 mm. (A) Treatment schema is shown. In groups 1 and 2, PBS was i.t. injected only into tumors on the left flank (L. i.t.). In group 3, MYXV was i.t. injected only into tumors on the left flank (L. i.t.). In groups 2 and 3, TRP-1 T cells were i.v. injected. In group 4, TRP-1 T10%MYXV cells were i.v. injected. (B-D) Tumor tissues (~100 mg/mice, 12 days after ACT) were harvested. Total RNA was extracted from the tumor tissues for RNA-seq (n=2). (B) Hierarchical clustering of expression levels of 25,240 genes. Heatmap of enriched genes of GO terms ‘inflammatory response’ (C) and ‘adaptive immune response’ (D) and GSEA between indicated treatments are shown. (E) Log fold-change ratio versus mean average expression plot of differentially expressed genes suggesting antitumor immunity in tumors after TRP-110%MYXV ACT or CTX treatment. (F) IFNγ ELISpot analysis of tumor-infiltrating CD4+ and CD8+ host T cells restimulated with irradiated B16TRP−1-KO ALVs. Representative images and statistical results are shown (n=5/group). Data are mean ± SD. ***P<0.001, TRP-1 T10%MYXV compared with any other groups (CD8+ T cells); **P<0.01, TRP-1 T10%MYXV compared with any other groups (CD4+ T cells), one-way ANOVA with Tukey test. Representative results from two repeated experiments are shown. (G) TRP-1 T10%MYXV cells (5×10⁶) were transferred i.v. into WT, CD4−/−, CD8−/− and CD3−/− B6 mice when B1620%TRP−1-KO tumors reached ~7×6 mm (similar to Figure 6A). Survival curves from 2 independent studies are summarized (n=9–11/group). **P<0.01, compared with any other groups, survival analysis was conducted by log-rank test. (H) WT and CD3−/− B6 mice were s.c. inoculated with 1×10⁶ (80% B16+20% B16TRP−1-KO+Ctrl) tumor cells. Some groups of mice were s.c. inoculated with 1×10⁶ (80% B16+20% B16TRP−1-KO+SKP−1) tumor cells. TRP-1 T10%MYXV cells (5×10⁶) were transferred i.v. into mice when tumors reached ~7×6 mm (similar to Figure 6A). Survival curves from two independent studies are summarized (n=9–11/group). **P<0.01, compared with any other groups, survival analysis was conducted by log-rank test. See also Figure S6.
