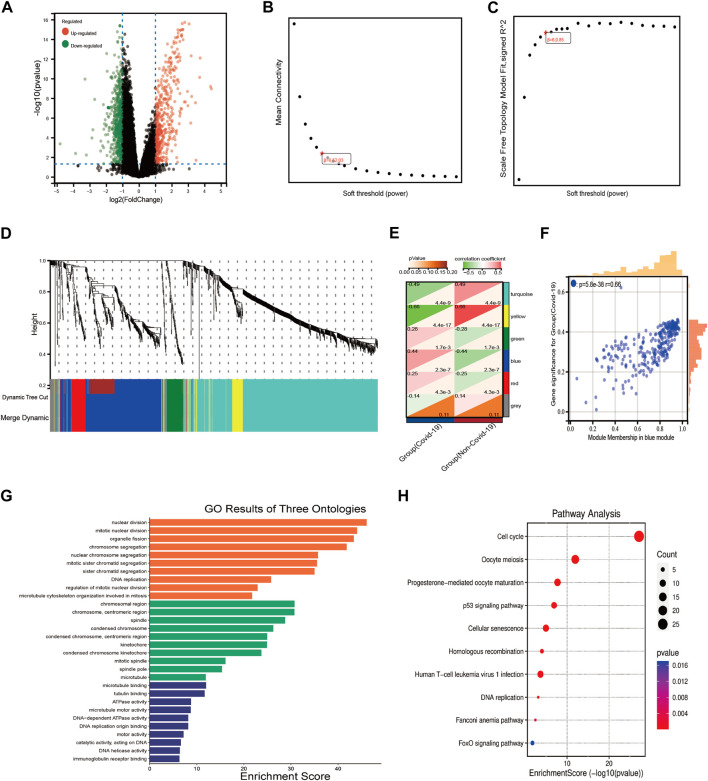
FIGURE 2.
WGCNA analysis and the functional pathway analysis. (A) The results of the DEGs of COVID-19. (B,C) Network topology analysis of different soft threshold power. (D) Dendrograms of genes acquired by mean linkage hierarchical clustering, A color branch of the cluster tree represents a co-expression module. (E) Module-trait relationships. The red color represents positive correlation and the green color represents negative correlation. The significance of the correlation was indicated by p-value. (F) The correlation between blue module and COVID-19. (G,H) The results of GO and KEGG pathway enrichment analysis.

