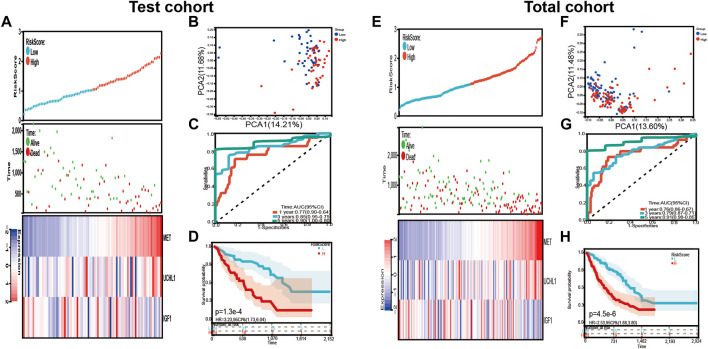
FIGURE 5.
Validation of the risk signature in the test cohort and total cohort. (A,E) the distribution of risk score, survival status, and expression levels of three differentially expressed prognostic genes related to COVID-19 in test cohort and total cohort. (B,F) The PCA plot of test cohort and total cohort (C,G) Time-dependent ROC analysis of our risk signature in test cohort and total cohort. (D,H) The overall survival of IPF patients in test cohort and total cohort.

