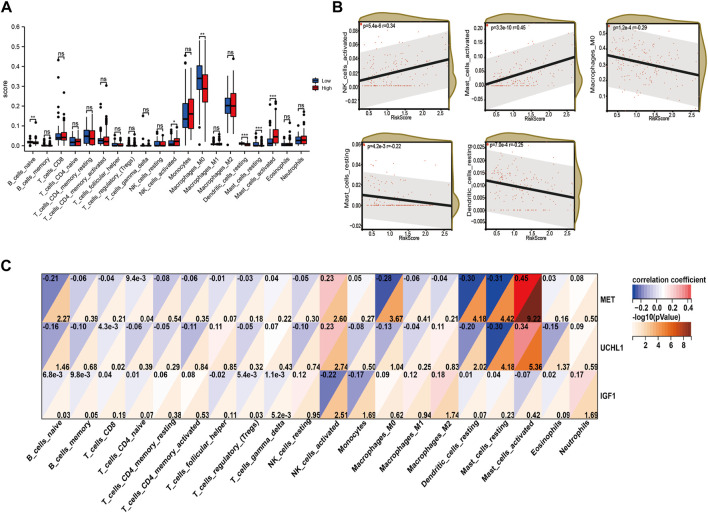
FIGURE 8.
The immune infiltrating cell analysis based on the risk score in training cohort. (A) The infiltrating levels of twenty-three cells in high-risk and low-risk group. (B) Association between the infiltrating levels and risk score. (C) Correlation between MET, UCHL1, IGF1, and infiltrated immune cells.

