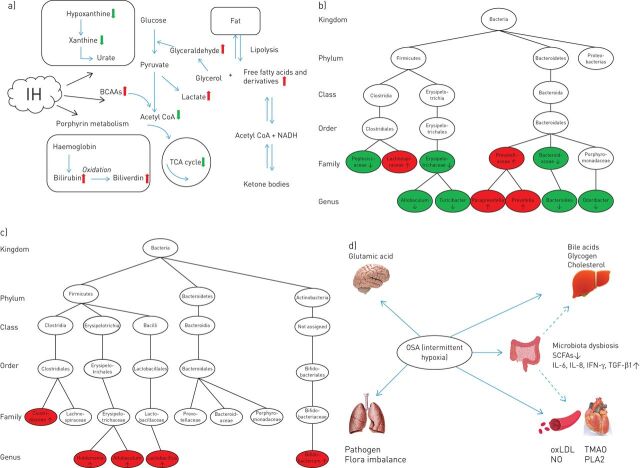
FIGURE 2.
a) Summary of metabolic alterations in obstructive sleep apnoea (OSA). The red arrows represent an increased level, while the green arrows represent a decreased level. IH: intermittent hypoxia; BCAAs: branch chain amino acids; TCA: tricarboxylic acid; NADH: nicotinamide adenine dinucleotide. b) Alterations of gut microbiota in OSA rodent models. Red represents an increase in relative abundance, while green represents a decrease. c) Alterations of gut microbiota in OSA-induced hypertension models. Red represents an increase in relative abundance. d) Cardiovascular, hepatic, pulmonary and cerebral complications caused by OSA and influenced by microbiota dysbiosis. The dotted arrows refer to the unclear mechanisms and pathophysiological pathways. SCFA: short-chain fatty acids; IL: interleukin; TGF: transforming growth factor; oxLDL: oxidised low-density lipoprotein; TMAO: trimethylamine oxide; PLA2: phospholipase A2; NO: nitric oxide.

