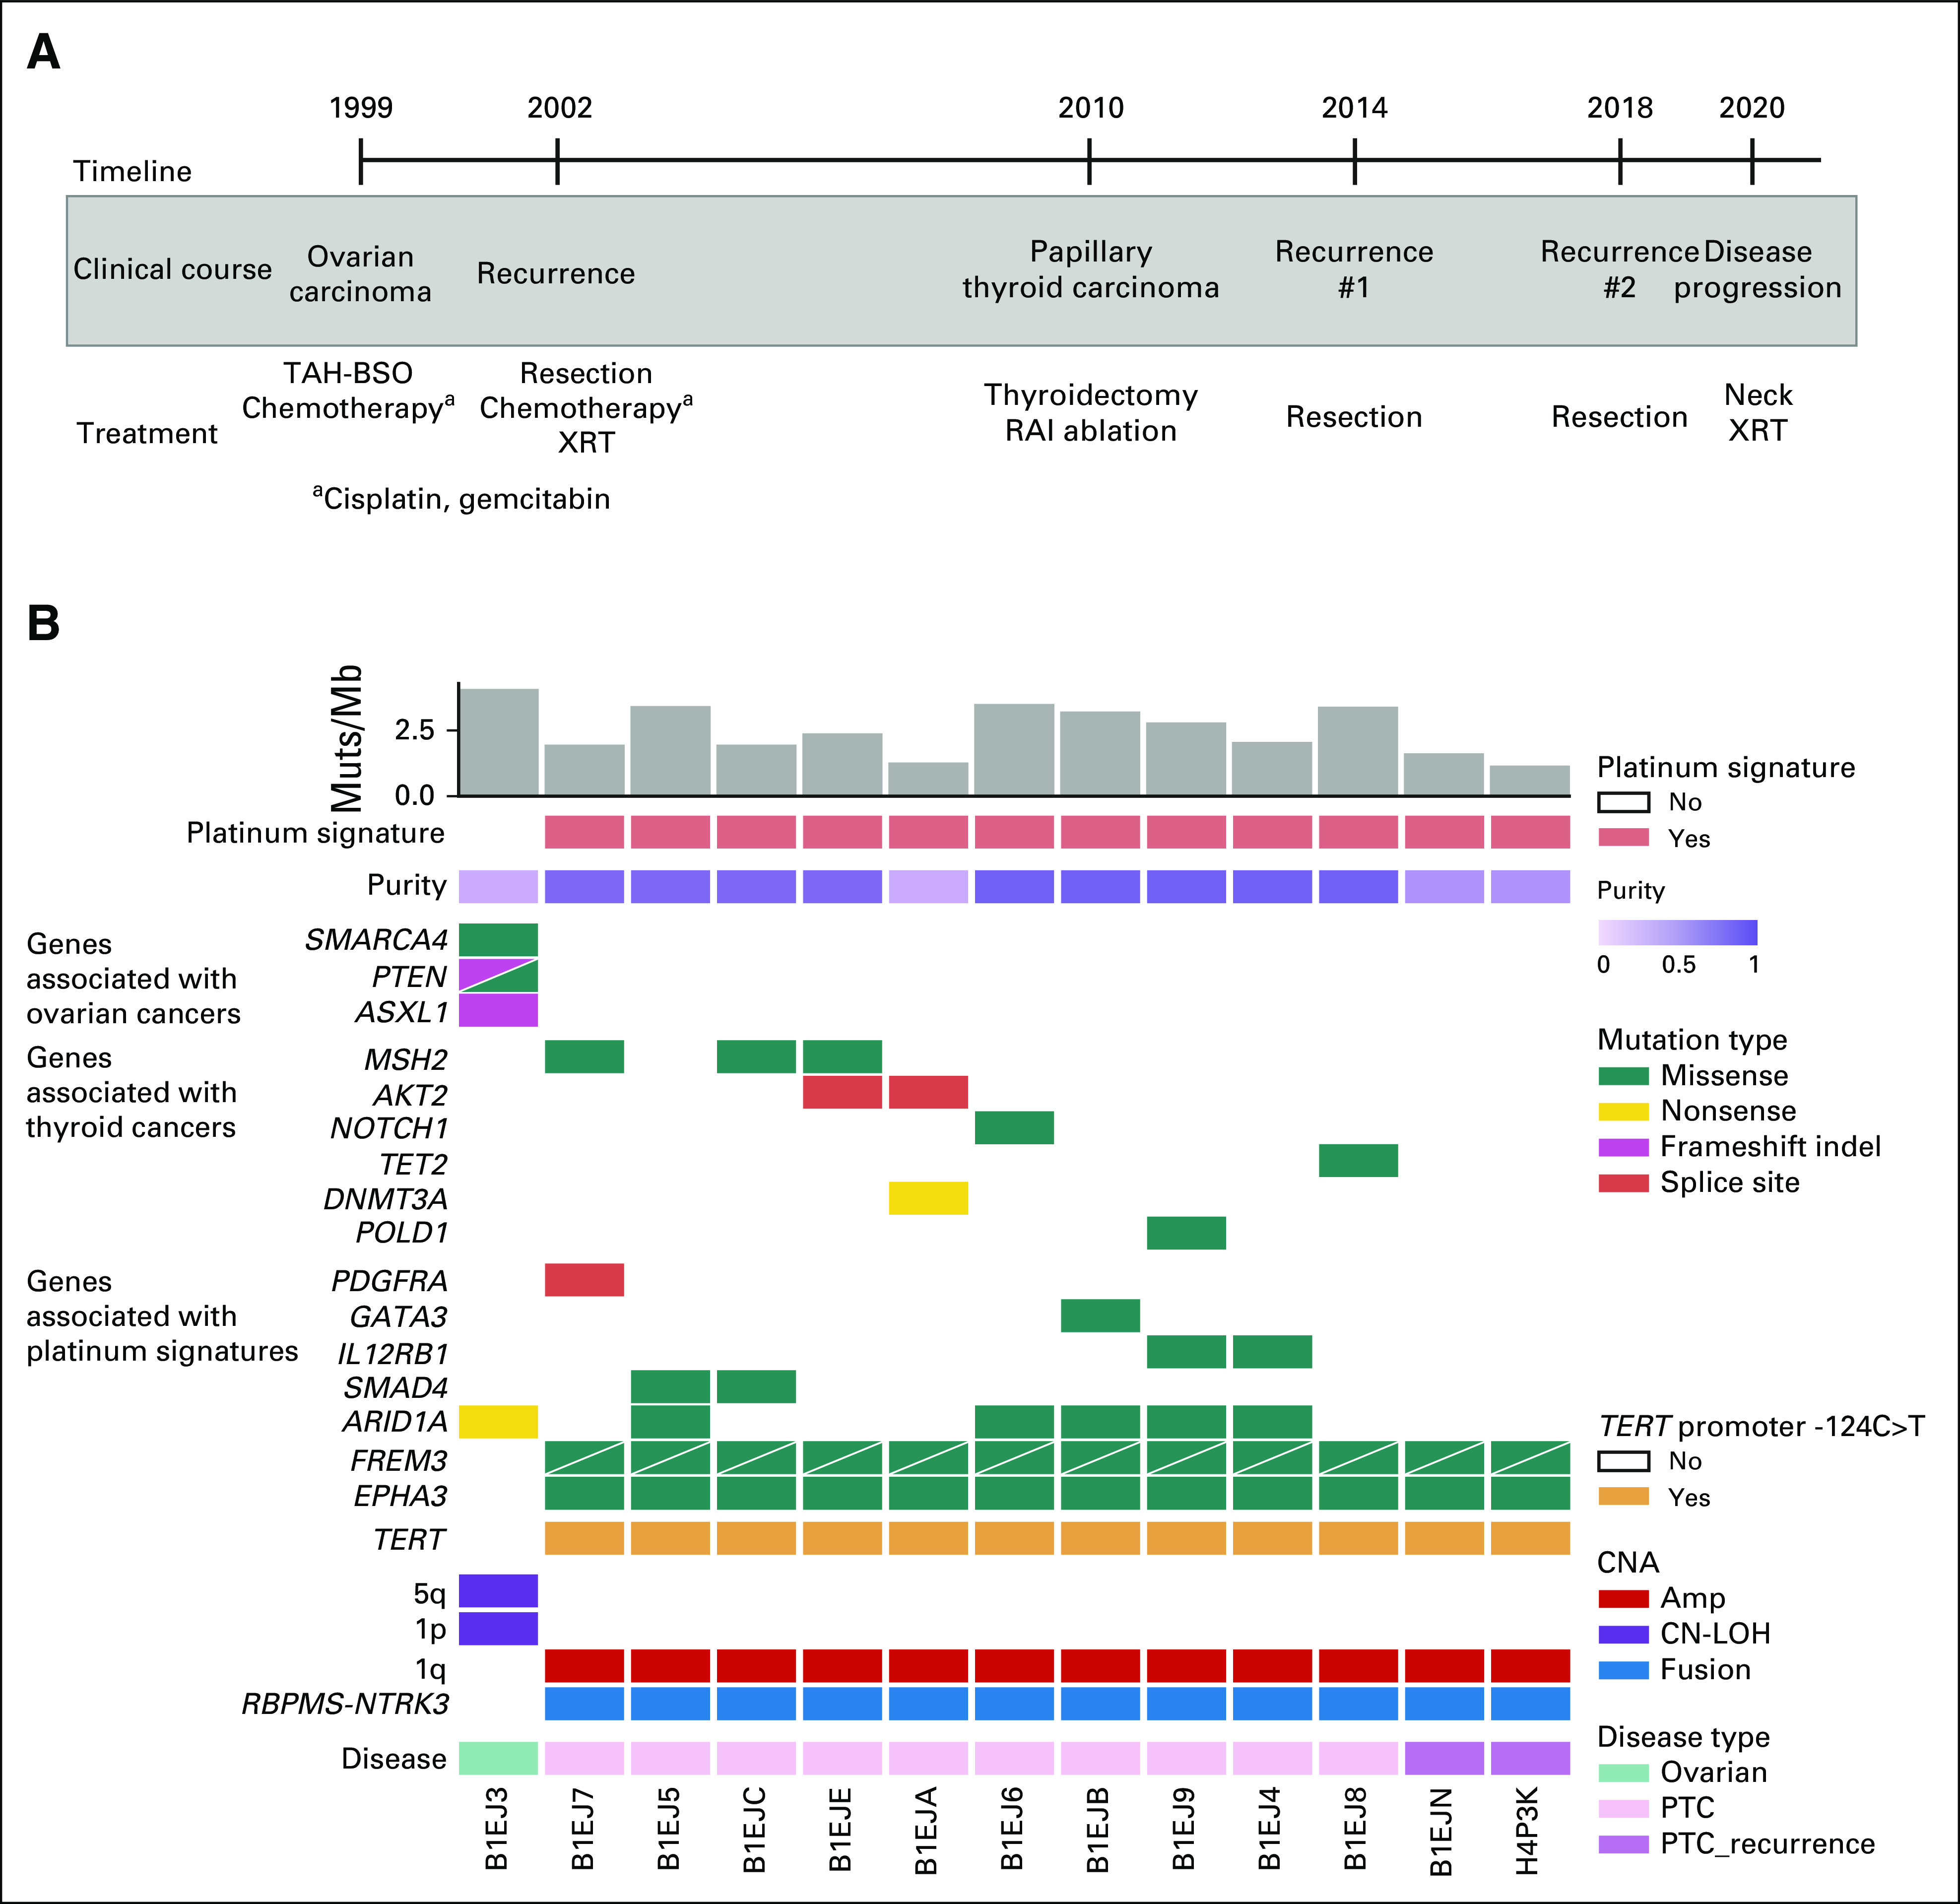
FIG 1.

Genomic landscape of the patient's ovarian and PTC. (A) Timeline of sample collection, the patient's clinical course, and treatment history identified in ovarian (1999-2002) and thyroid cancer (2010-2020). (B) The CoMut7 plot illustrates select single nucleotide and insertion/deletion events, as well as CNA, RBPMS-NTRK3 RNA fusion, and TERT promoter status. The plot also includes the mutation burden, presence of the platinum signature determined by deconstructSigs and SigProfiler, and tumor purity as determined by ABSOLUTE. Each row represents the mutation or copy-number status for the indicated gene, and each column represents a unique tumor sample (ovarian or PTC samples). Two mutations in the same gene are represented by triangles. Amp, amplification; CN-LOH, copy-neutral loss of heterozygosity; CNA, copy-number alteration; Muts, mutations; PTC, papillary thyroid carcinoma; RAI, radioactive iodine; TAH-BSO, total abdominal hysterectomy and bilateral salpingo-oophorectomy; XRT, radiation therapy.
