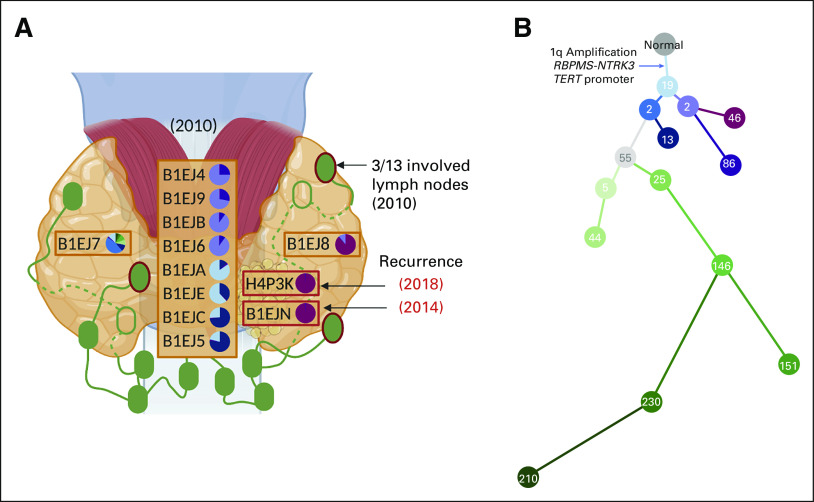
FIG 2.
The spatial and temporal tumor heterogeneity in PTC. (A) A map of the PTC sample locations collected during the initial 2010 thyroidectomy (three orange boxes with 10 samples) and subsequent surgeries for locoregional recurrence in 2014 and 2018 (two red boxes with two samples). Three lymph nodes (green ovals with red borders) were positive for the spread of the tumor. Green empty ovals represent two lymph nodes posterior to the thyroid. Pie charts represent the fraction of each subclone found in each sample with a common ancestor existing in all PTC samples. (B) A phylogenetic tree of each subclone represented in the pie charts of Figure 2A. Number in the circle indicates the number of variants assigned to each subclone. The clonal events shared by all PTC samples were annotated in the tree. PTC, papillary thyroid carcinoma.

