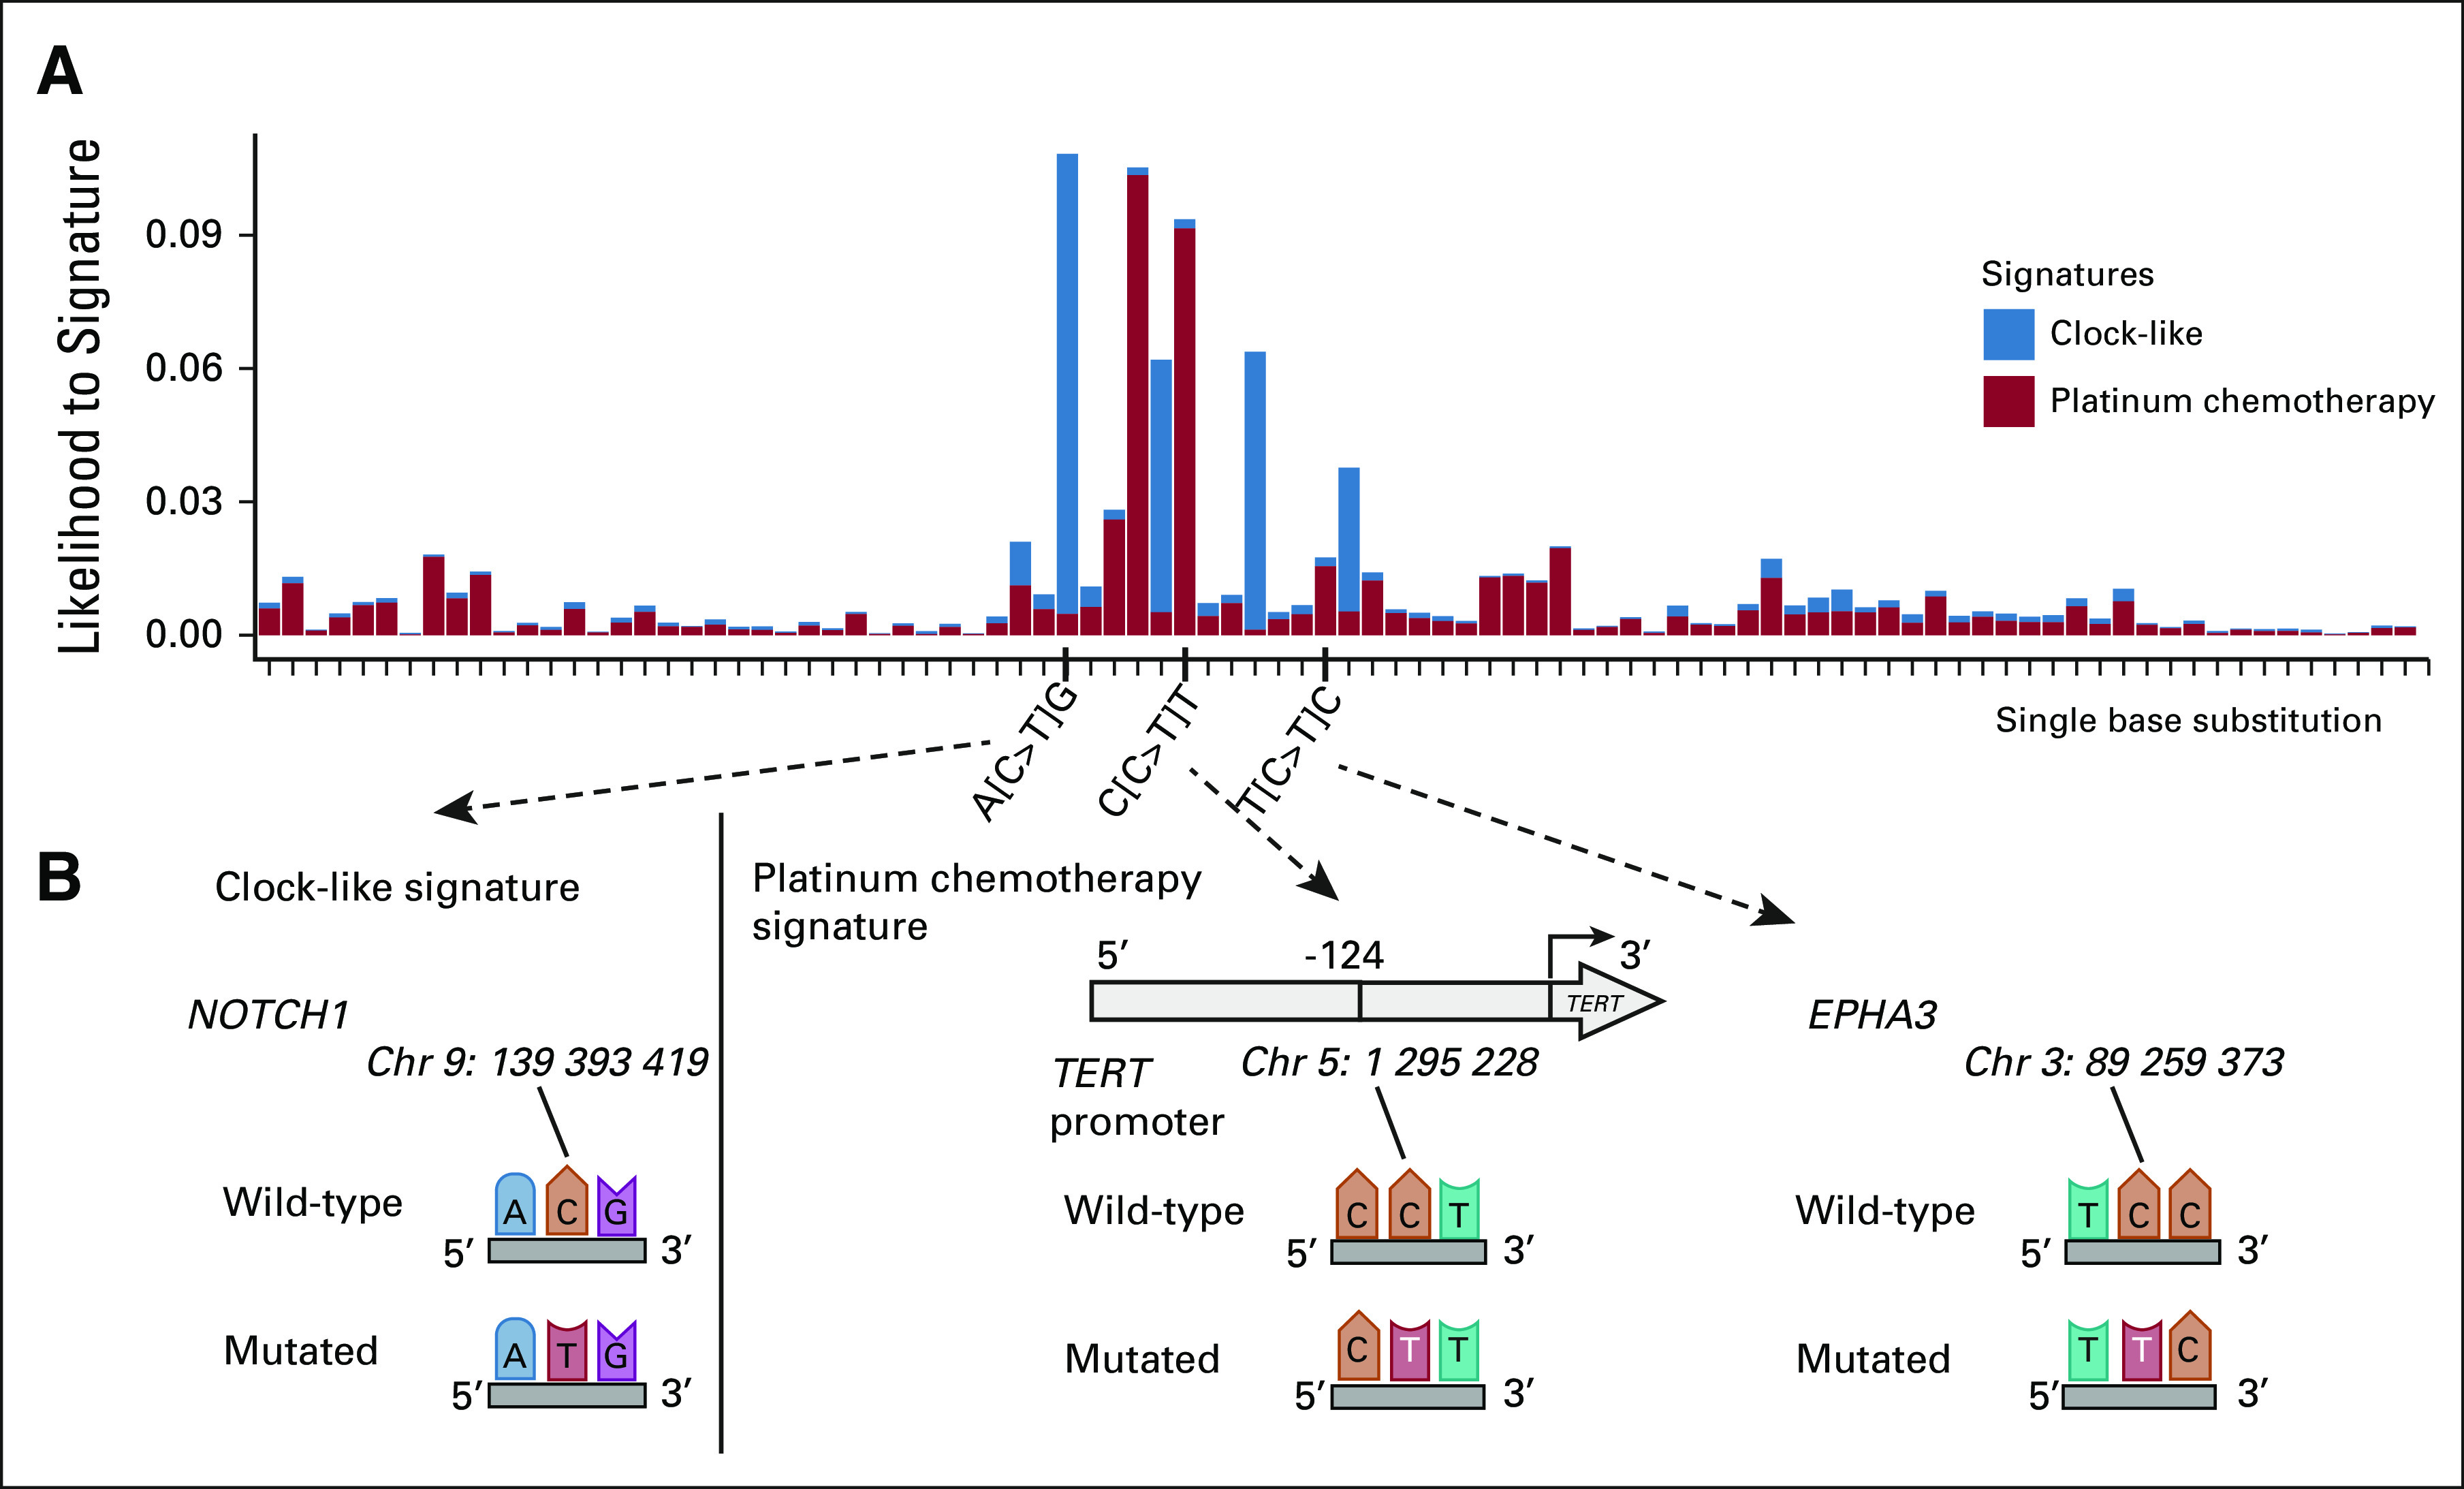
FIG 3.

Single base substitution attribution to platinum chemotherapy signature. (A) The y-axis indicates the likelihood of observing the single base substitution induced by a specific signature using SigProfiler. The x-axis indicates single base substitution in 96 trinucleotide contexts. SBS1 and SBS5 were summarized as clock-like signatures. SBS31 and SBS35 were indicated as platinum chemotherapy signatures. (B) Nucleotide context with single base substitution changes in NOTCH1, TERT promoter, and EPHA3 genes.
