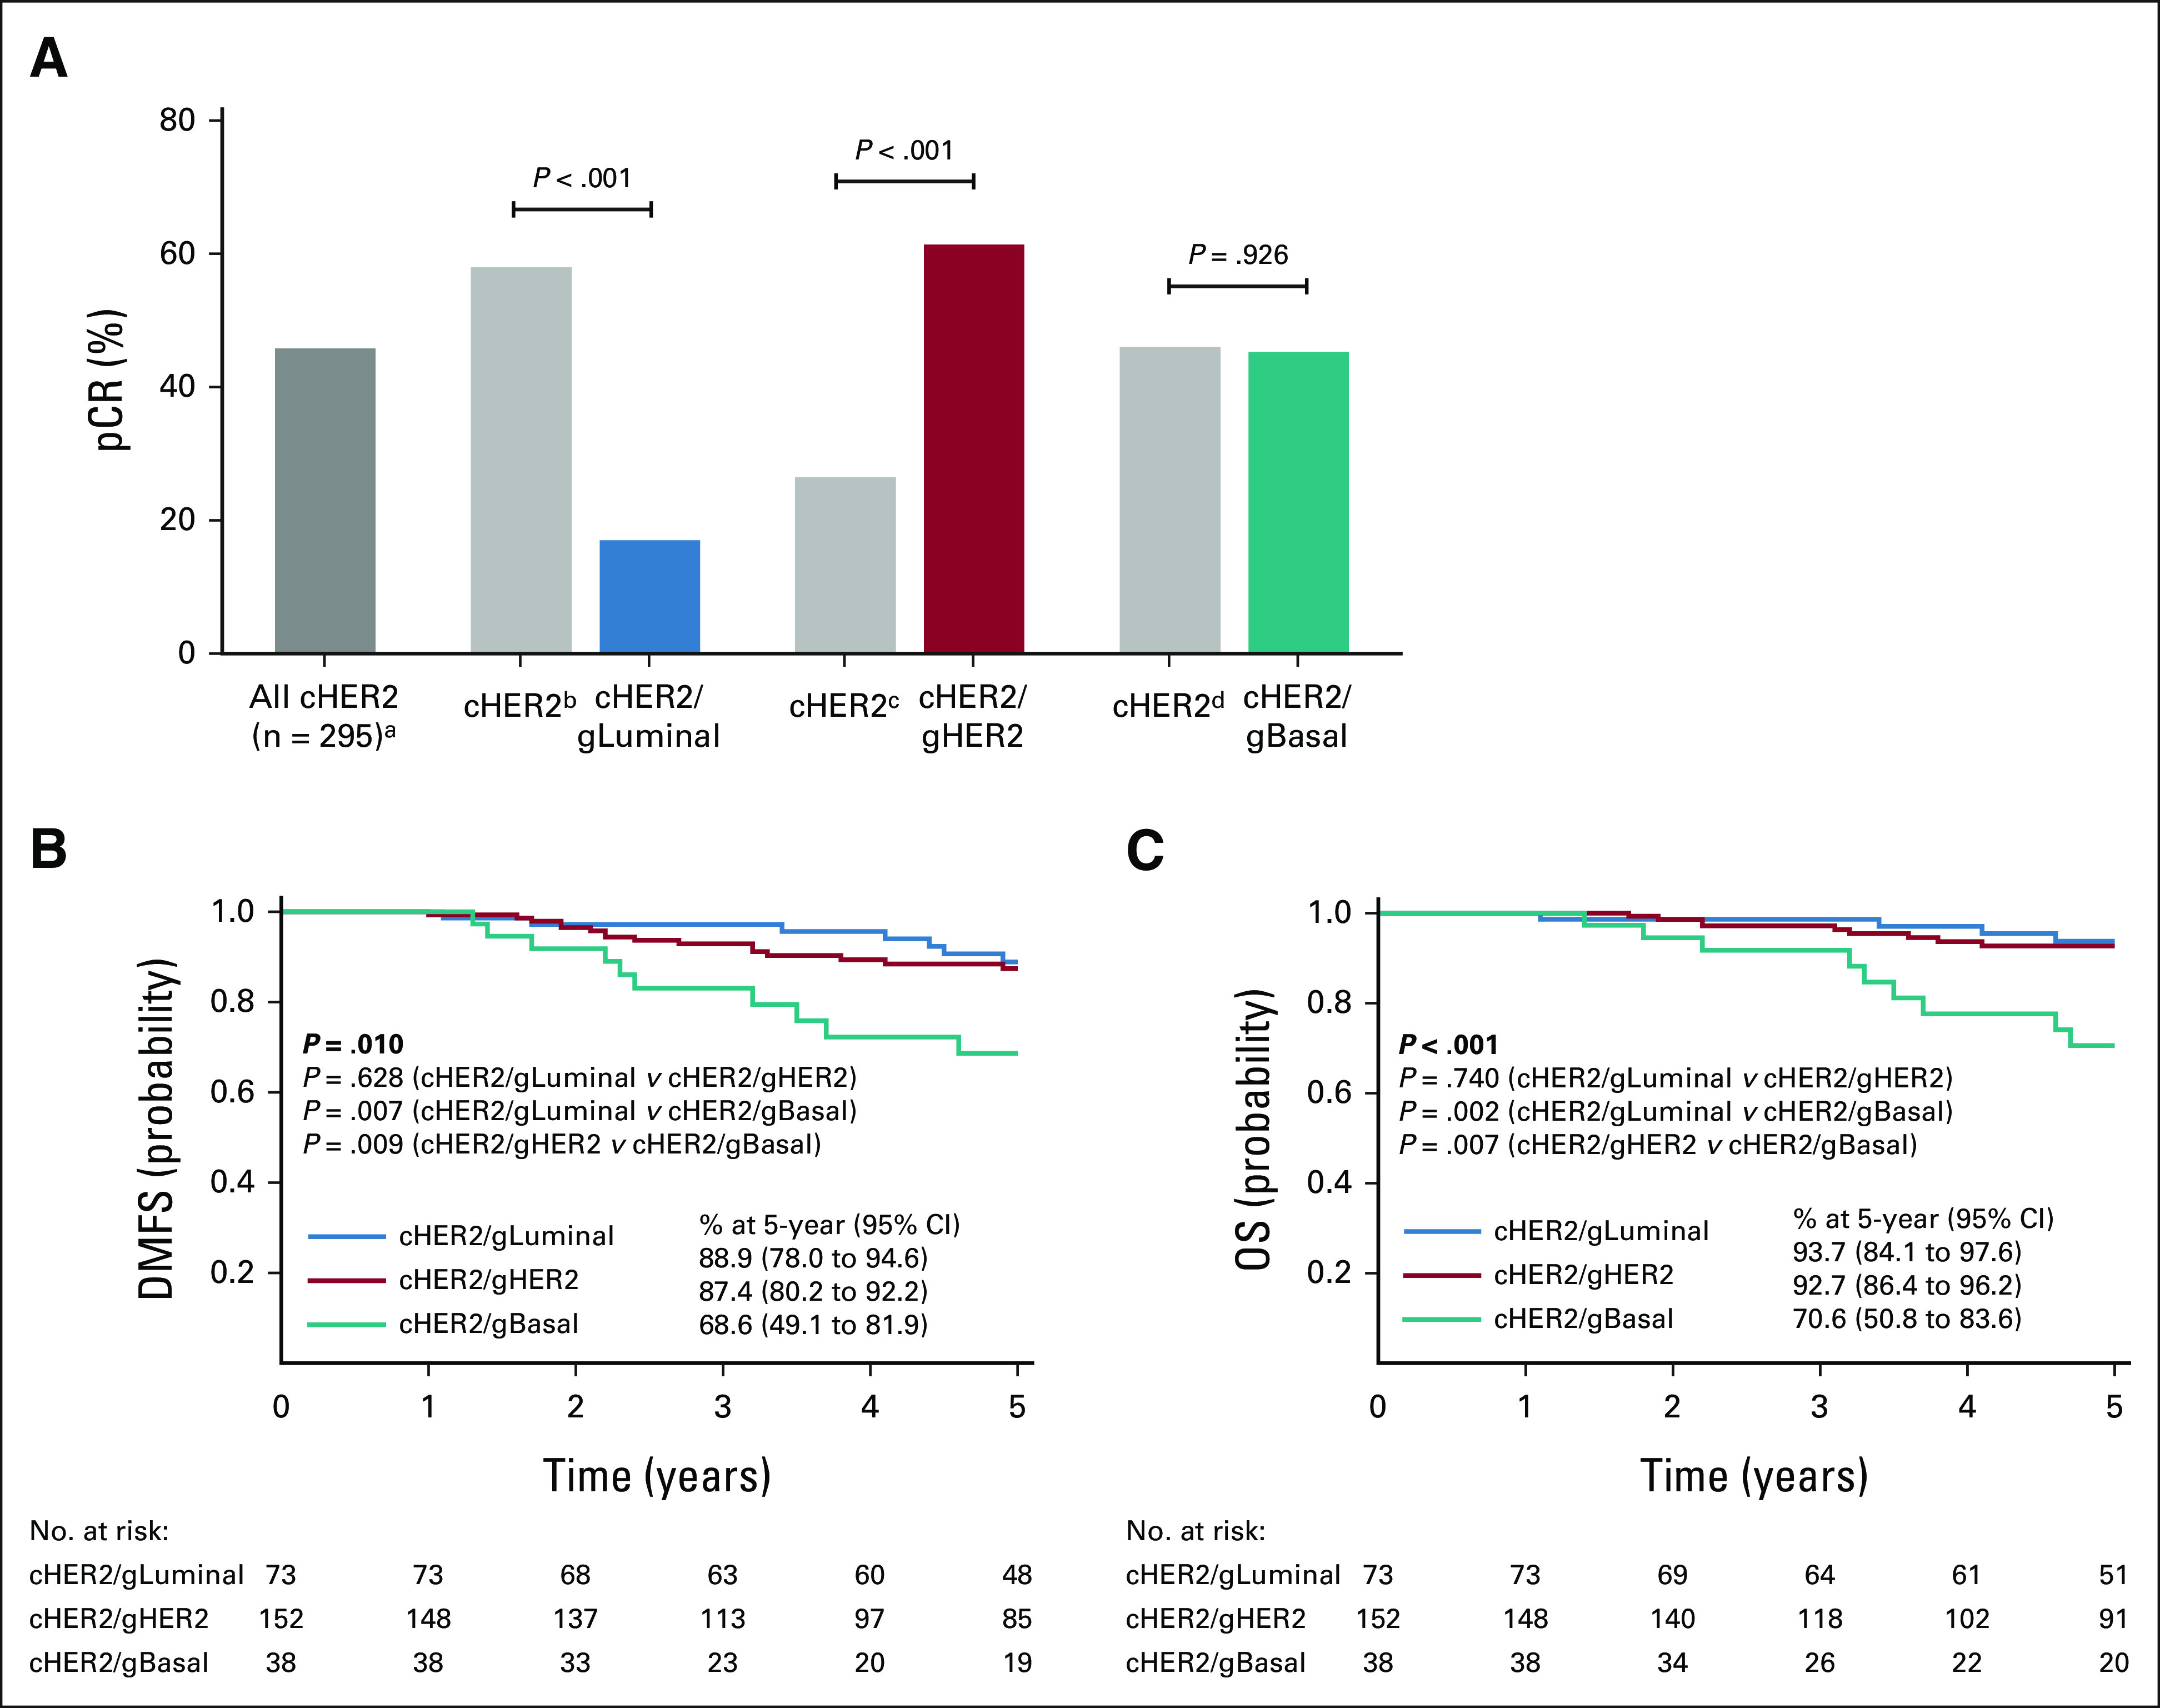
FIG 2.

Therapeutic response and 5-year outcomes by BluePrint. (A) The pCR rate of all 295 cHER2 patients (adark gray bar) compared with pCR rates when stratified by BluePrint. The pCR rates of each BluePrint molecular subtype are shown (blue, cHER2/gLuminal; red, cHER2/gHER2; teal, cHER2/gBasal) with the remaining proportion of immunohistochemistry-/fluorescence in situ hybridization–defined HER2+ patients shown for each comparison in light gray bars: bcHER2/gHER2 and cHER2/gBasal, ccHER2/gLuminal and cHER2/gBasal, and dcHER2/gLuminal and cHER2/gHER2. Significance was evaluated using a two-tailed proportional z-test. Five-year probabilities of (B) DMFS and (C) OS for each BluePrint subgroup were assessed by the log-rank test. cHER2, clinically defined HER2+; DMFS, distant metastasis-free survival; gBasal, genomically defined Basal-Type; gHER2, genomically defined HER2-Type; gLuminal, genomically defined Luminal-Type; OS, overall survival; pCR, pathologic complete response.
