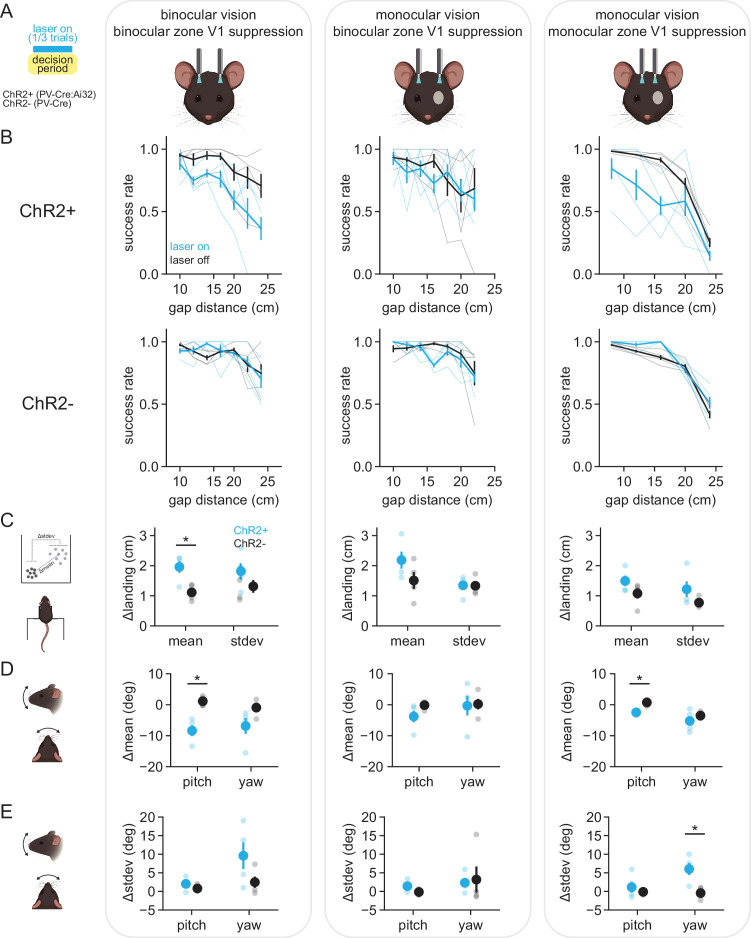
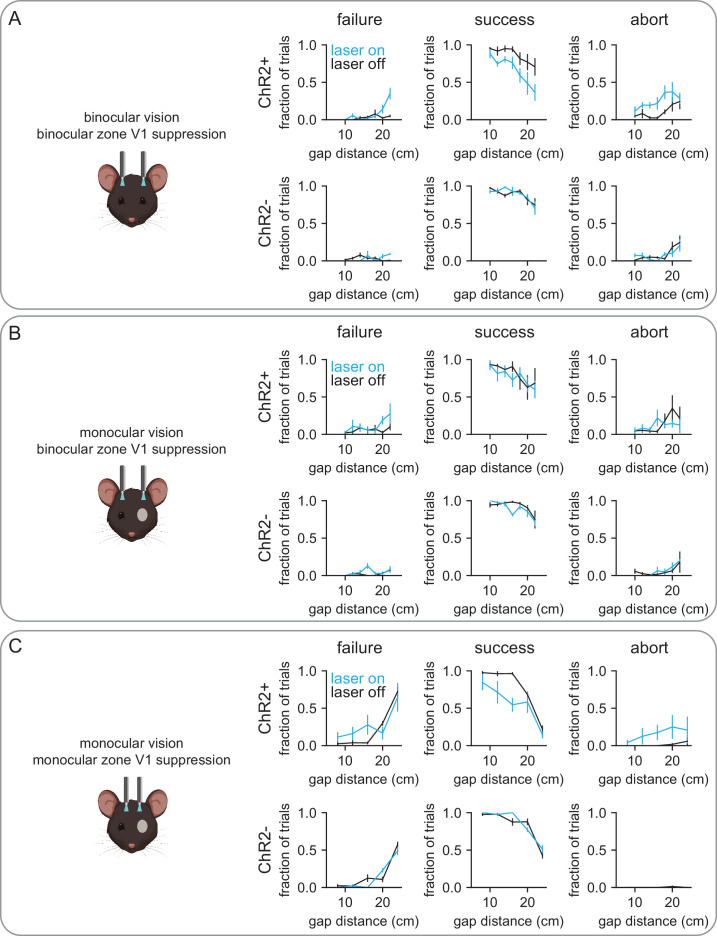
Figure 5. V1 optogenetic suppression disrupts distance estimation task performance.
(A) Schematic of experimental setup for optogenetic experiments; bilateral illumination of either binocular or monocular zone V1 in either binocular or monocular animals during the decision period on one-third of trials. All plots within a column correspond to the schematized condition. (B) Performance curves for laser-off (black) and laser-on (cyan) conditions in mice expressing ChR2 in PV+ inhibitory interneurons (ChR2+, top row) or PV-Cre only mice (ChR2-, bottom row). Thin lines are individual animal data. (C) Change in the mean and standard deviation of landing positions, averaged across mice. Small circles are individual animal data. (D) Change in the mean head angle for up-down (pitch) and side-to-side (yaw) head position. (E) Same as (D) but change in standard deviation of pitch and yaw.


