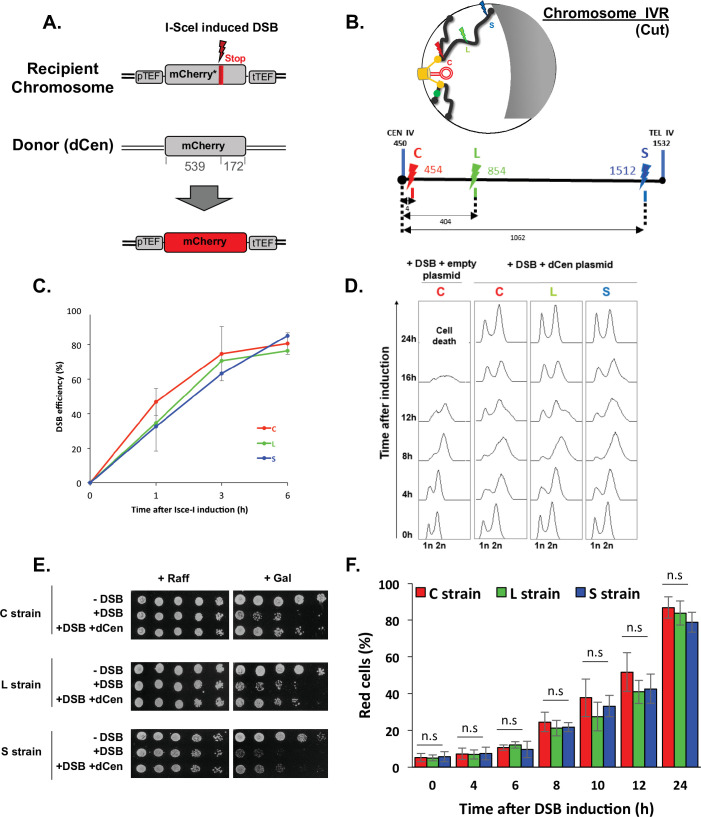
Figure 1. Tracks homologous recombination in vivo (THRIV), a system to follow homologous recombination (HR) in vivo.
(A) Schematic representation of the two sequences used to track recombination events during time. The recipient mCherry-I-SceI has a 30pb I-SceI sequence followed by a stop codon (red bar) inserted at 57 amino acids from the end of the mCherry coding sequence. The donor (dCen) is a full-length mCherry lacking promoter and terminator sequences, carried on a centromeric plasmid. A functional mCherry could be expressed only after HR. (B) Schematic 2D representation of the Rabl spatial configuration of two chromosomes in the nucleus of Saccharomyces cerevisiae. The spindle pole body (rectangle), the microtubules (lines), and the centromeres (spheres) are in yellow. Telomeres are shown as gray/black spheres attached to the nuclear envelope. An orange circle represents the dCen plasmid. The gray crescent symbolizes the nucleolus. Lightening symbolize the targeted I-SceI cutting sites (cs) on chromosome IVR arm, with same color code as in the linear representation represented below. The cs are respectively located at 5 kb from centromere CEN IV (red, strain C), 400 kb from CEN IV (green, strain L), and 20 kb from telomere TEL IVR (blue, strain S), distances are in kb The green dot visualizes the locus used to monitor mobility on undamaged chromosome VR. (C) I-SceI cleavage efficiency is measured in a non-donor strain by qPCR using primers flanking the I-SceI cs. The error bars represent the standard deviation of five or two independent experiments for strain C and strains L, S, respectively. (D) FACS analysis of the cell cycle of strains C, L, and S after induction of I-SceI with or without dCen plasmid. For the quantification of the cell cycle progression, the amount of DNA is measured with Sytox after fixation with ethanol and treatment with RNase. The peaks corresponding to 1n and 2n amount of DNA are indicated. (E) Drop assay (10-fold serial dilutions) showing the sensitivity of C, L, and S strains, containing a plasmid expressing or not I-SceI (-DSB, +DSB, respectively), with dCen plasmid or without (empty plasmid), when I-SceI is induced for 48 hr (galactose) or not (raffinose). (F) HR kinetics upon induction of I-SceI in the presence of dCen in C, L, or S strains. Percentages of repaired red cells were measured by FACS after PFA fixation in the absence of Sytox. Error bars represent the standard deviation of three independent experiments, five independent experiments for strain C. Mann-Whitney test, n.s., non-significant.


