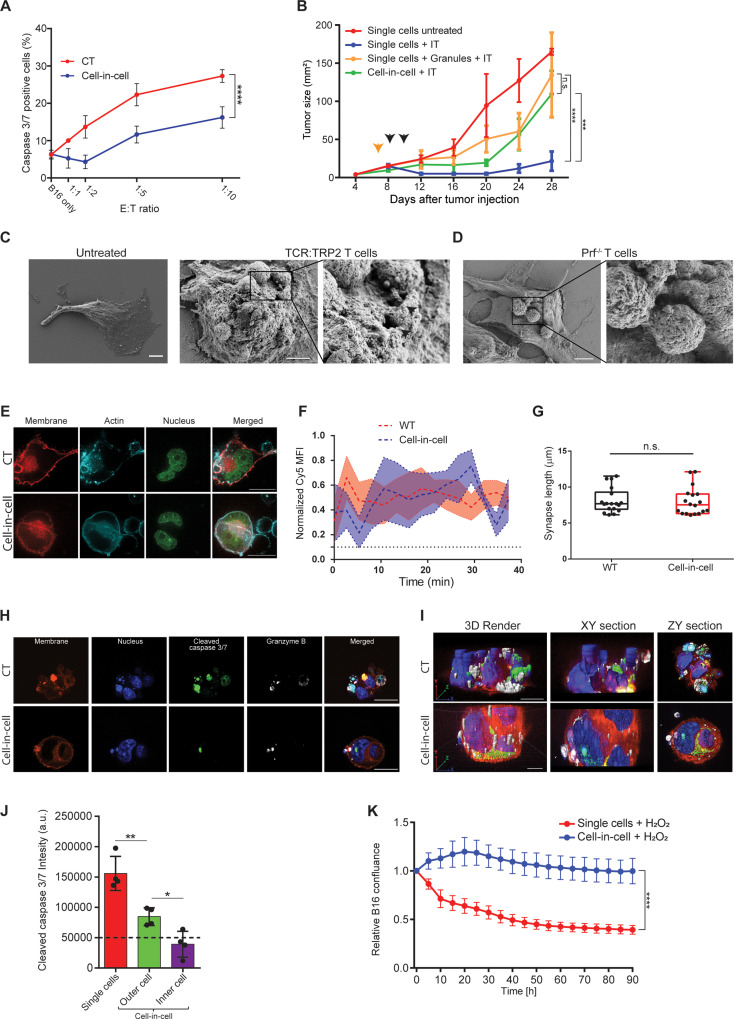
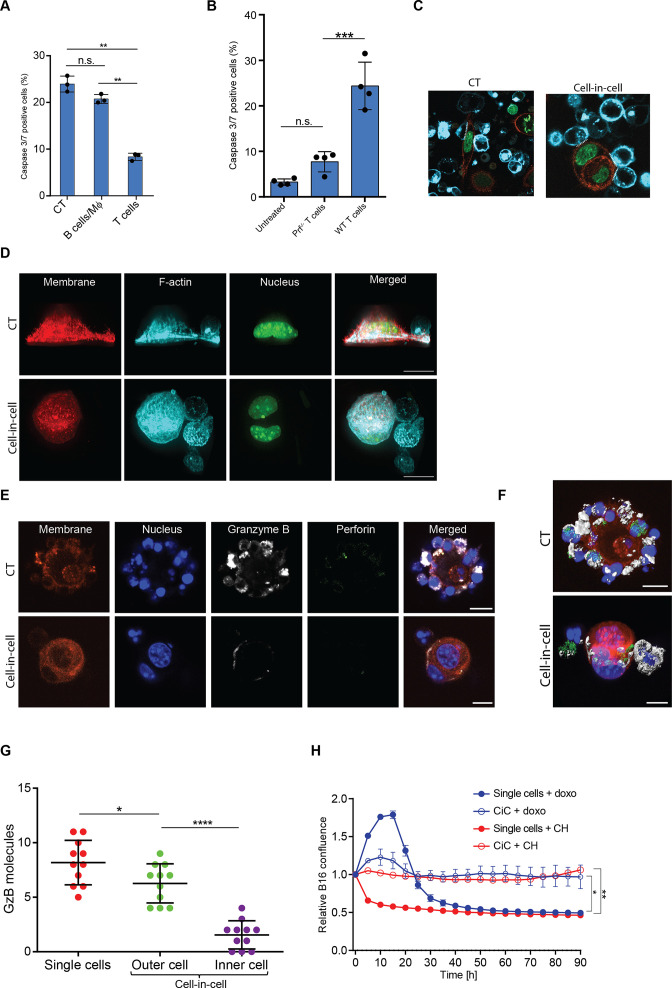
Figure 5. Cell-in-cell formations spatially prevent the penetration of T cell-derived lytic granules to the inner tumor cells.
(A) Mean percentages of apoptotic tumor cells following overnight incubation with gp100-reactive CD8+ T cells. (B) B16F10 tumor size following treatment with DC adjuvant and anti-TRP1 antibodies (IT). B16F10 were injected as single cells, with or without injection of T cell-secreted granules (Granules), or as cell-in-cell. Black arrowheads indicate IT, yellow arrowhead indicates granules injection. (C–D) SEM analysis of B16F10 incubated with TRP2-reactive CD8+ T cells from WT (C) or Prf1-/- mice (D). (E) Confocal plane image of B16F10 incubated with tumor-reactive CD8+ T cells. (F) Normalized intensity of T cell’s cortical actin (Cy5) over time at immunological synapses (n=5). (G) Immunological synapse length between B16F10 and tumor-reactive CD8+ T cells (n=18). (H) Confocal plane image of B16F10 incubated with tumor-reactive CD8+ T cells. (I) 3D rendering and surface detection and 3D sections (XY and ZY planes) of B16F10 cells incubated with tumor-reactive CD8+ T cells. (J) Mean fluorescence intensity of cleaved caspase 3/7 in B16F10 tumor cells following incubation with gp100-reactive CD8+ T cells (n=3). (K) Relative confluence over time of B16F10 single cell or cell-in-cell, cultured following incubation with H2O2 (n=3). Experiments were repeated independently at least three times. Statistical significance was calculated using ANOVA with Tukey’s correction for multiple comparisons (* denotes p<0.05, ** denotes p<0.01, *** denotes p<0.001, **** denotes p<0.0001). Error bars represent standard error. Scale bars = 5 μm (C, D), 20 μm (E, H, I).


