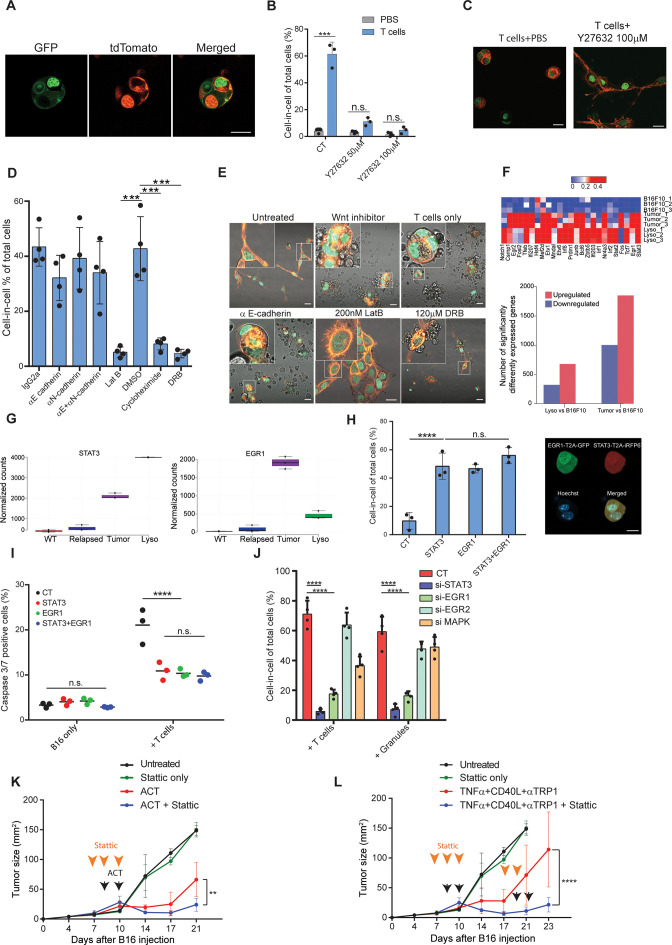
Figure 6. STAT3 and EGR1 signaling govern T cell-mediated cell-in-cell tumor formation.
(A) Representative images of B16F10, co-expressing Lifeact-GFP and H2b-tdTomato or MyrPalm-tdTomato and H2b-GFP, following incubation with gp100-reactive T cells. (B) Mean percentage of cell-in-cell tumor formations in B16F10 following overnight incubation with gp100-reactive CD8+ T cells with or without ROCK inhibitor (n=3). (C) Representative images of cell-in-cell tumor formations in B16F10 following overnight incubation with gp100-reactive CD8+ T cells with or without ROCK inhibitor. (D) Mean percentage of cell-in-cell tumor formations in B16F10 cells following overnight incubation with specific inhibitors and reactive CD8+ T cells (n=4). (E) Representative images of B16F10 cells treated with inhibitors and incubated overnight with gp100-reactive CD8+ T cells. (F) Significantly increased genes in B16F10 cells incubated with T cell-derived granules (Lyso) or isolated directly from relapsed tumors (Tumor), compared to B16F10 control cells (WT) (Bottom) and relative expression of the top 25 genes (Top) (n=3). (G) STAT3 and EGR1 expression levels in B16F10 cells isolated directly from relapsed tumors (Tumor) and after incubation with T-cell-derived granules (Lyso) compared to B16F10 control cells (WT) (n=3) (H) Mean percentage and representative images of cell-in-cell tumor formations in B16F10 48 hours after transfection with STAT3-T2A-iRFP670, EGR1-T2A-GFP or both (n=3). (I) Mean percentage of apoptotic B16F10, transfected with STAT3-T2A-iRFP670, EGR1-T2A-GFP or both, following incubation with tumor reactive T cells (n=3). (J) Mean percentage of cell-in-cell tumor formations in B16F10, transfected with siRNA, following incubation with tumor reactive T cells or T cells secreted granules. (K–L) B16F10 tumor size in mice treated with gp100-reactive T cells (ACT) (K) or Dc adjuvant and anti-TRP1 antibodies (L) with or without Stattic (n=4). Orange arrowheads indicate Stattic treatments and black arrowheads indicate injection of immunotherapies. All experiments were repeated independently at least three times. Statistical significance was calculated using ANOVA with Tukey’s correction for multiple comparisons (**denotes p<0.01, *** denotes p<0.001, **** denotes p<0.0001). Error bars represent standard error. Scale bars = 20 μm.


