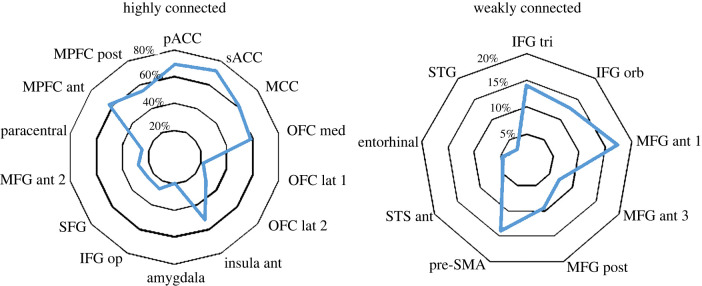
Figure 2.
Percentage distribution of CCEPs. Radar plots illustrate the distribution of CCEPs in regions showing high (i.e. CCEPs greater than 20% of sampled responses) and weak (i.e. CCEPs less than 20% of sampled responses) effective connectivity with the pACC. Values are expressed as percentages. sACC, subgenual ACC; pACC, pregenual ACC; MPFC, medial prefrontal cortex; MCC, midcingulate cortex; OFC, orbitofrontal cortex; MFG, middle frontal gyrus; IFG, inferior frontal gyrus; SFG, superior frontal gyrus; STS, superior temporal sulcus; STG, superior temporal gyrus; pre-SMA, pre-supplementary motor area. For the precise location of the region according to the Lausanne2008 (resolution 60) parcellation, see electronic supplementary material, figure S2. (Online version in colour.)

