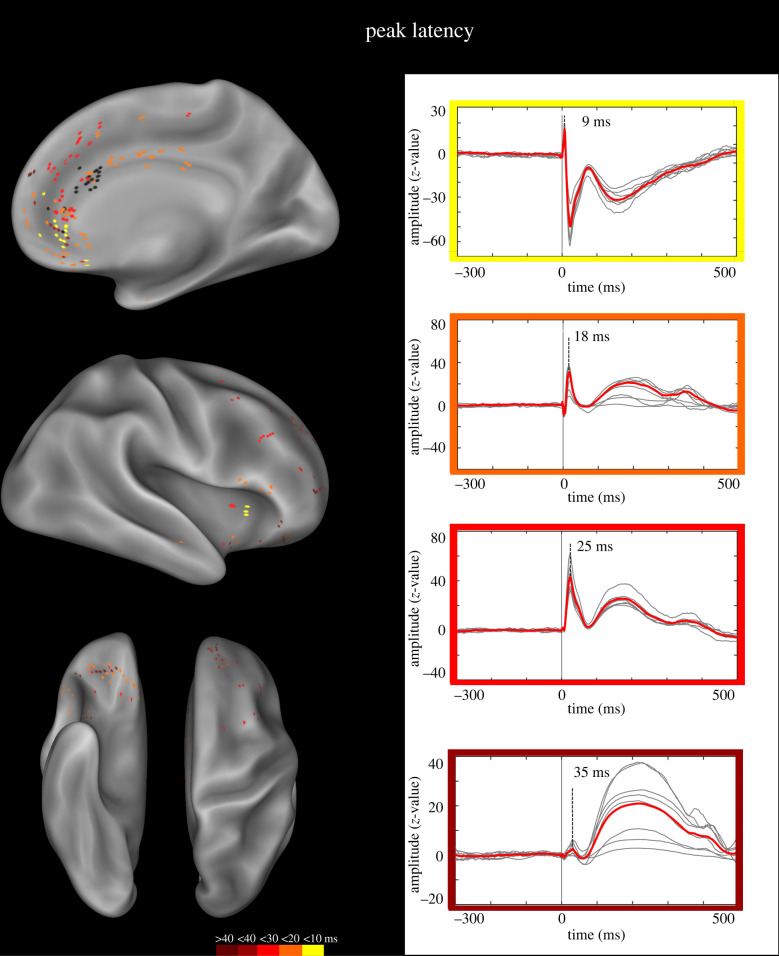
Figure 3.
N1 peak latency. Left panel. Anatomical distribution of the peak latency of the N1 potential. The colour scale indicates the CCEP peak latency. Black dots indicate the contacts whose HF-ES induced laughter and whose SPES was used for the CCEP study. Both left and right contacts are plotted on the right hemisphere of the inflated surface of the FS_LR brain template. Right panel. Representative CCEP for each of four temporal windows (CCEPs with latency greater than 40 ms not shown). (Online version in colour.)

