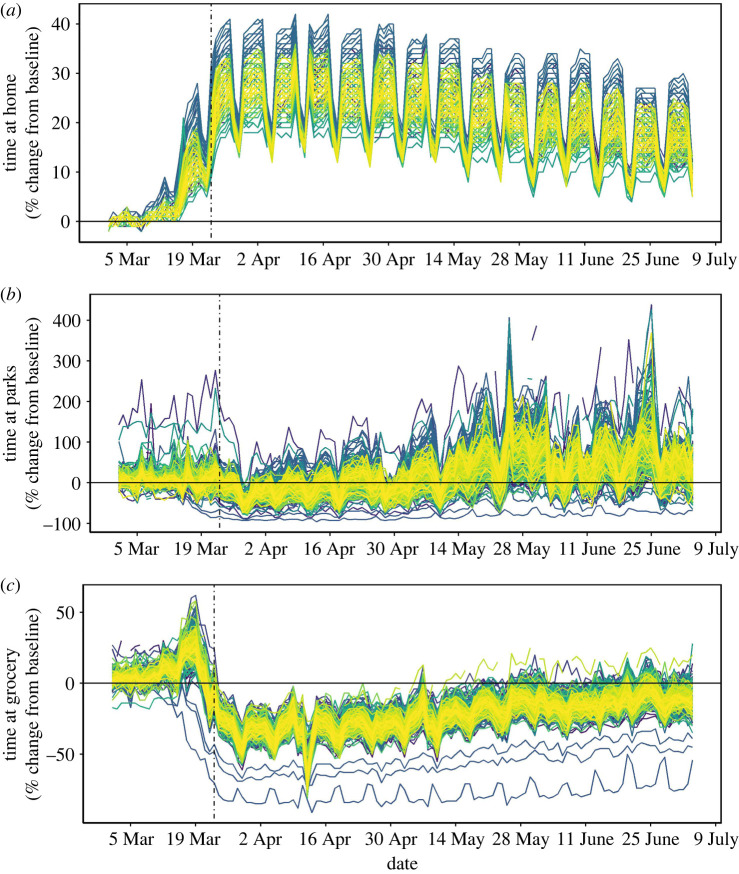
Figure 1.
Percentage change from baseline in daily human mobility (one line for each region) in the UK from 1 March to 4 July 2020. Vertical dashed line marks the first day of lockdown on 23 March 2020. Time spent at home/parks/grocery (a–c) (y-axis) was calculated by Google LLC (2020). (Online version in colour.)

