
Figure 1.
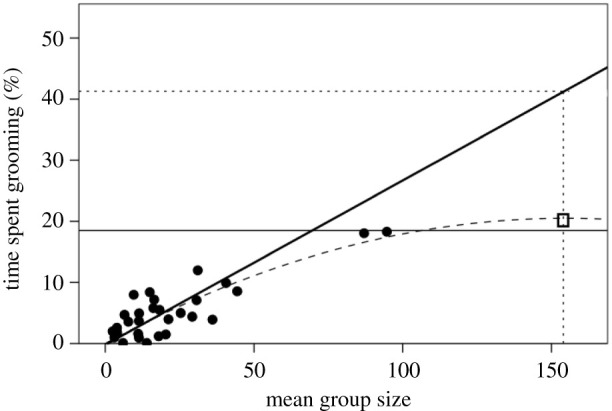
Mean per cent of daytime devoted to social grooming as a function of mean group size for individual anthropoid primate genera. The dashed line is the best fit quadratic regression (r2 = 0.684, F2,26 = 29.2, p < 0.0001); the heavy solid line is the reduced major axis linear regression for groups of less than 45 (ordinary least squares regression: r2 = 0.599, F1,25 = 14.0, p = 0.001). The thin solid line demarcates the upper limit on observed grooming time at 18.5% of total daytime. The dotted lines plot the predicted grooming time for humans (Homo sapiens) living in their observed mean group size of 154 [45]. The square identifies the mean time devoted to social interaction (predominantly conversation, of course) in seven widely different human societies [45]. The data are given in the electronic supplementary material table S1.