
Figure 6.
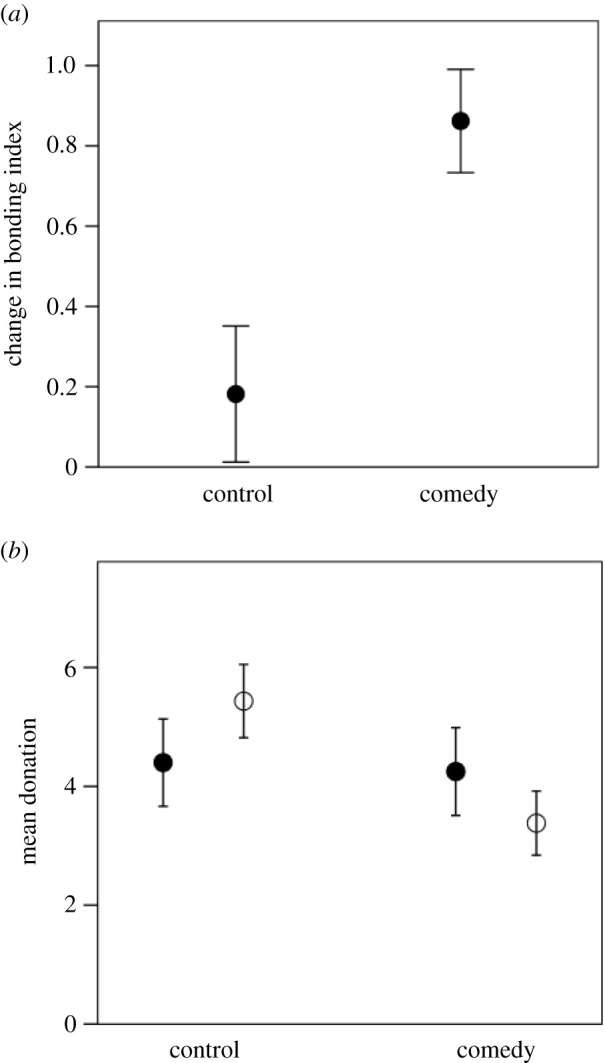
(a) Mean (±1 s.e.) difference in bonding index from before to after the experimental intervention in the control and comedy condition from experiment G in figure 4. The bonding index is the IOS [77]. Sample size is n = 50 subjects. (b) Monetary donations made to another group member (on a 0–10 scale) in experiments F (filled symbols) and G (unfilled symbols) in figure 3. Source [18].