
Figure 2.
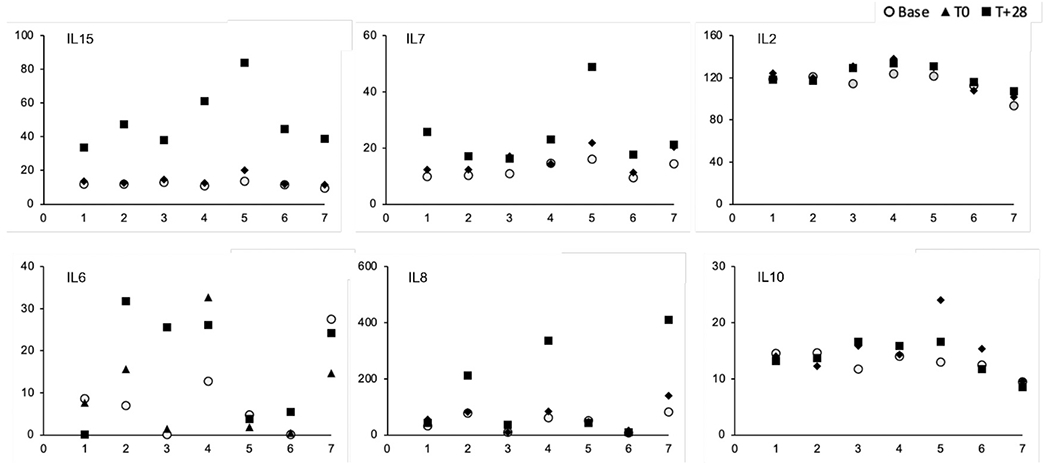
Serum cytokine assays obtained from 7 study subjects before (baseline; circles); on the day of (T0; triangles), and 28 days after (T+28; squares) the first NK cell infusion. All cytokine levels are in pg/mL (y-axis); individual subjects are on the x-axis.