
Figure 7.
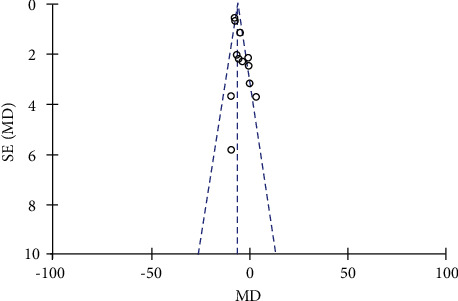
Scatter funnel plot of risk ratios on the X-axis against the standard error of log risk ratio on the Y-axis.
Official websites use .gov
A
.gov website belongs to an official
government organization in the United States.
Secure .gov websites use HTTPS
A lock (
) or https:// means you've safely
connected to the .gov website. Share sensitive
information only on official, secure websites.
Scatter funnel plot of risk ratios on the X-axis against the standard error of log risk ratio on the Y-axis.