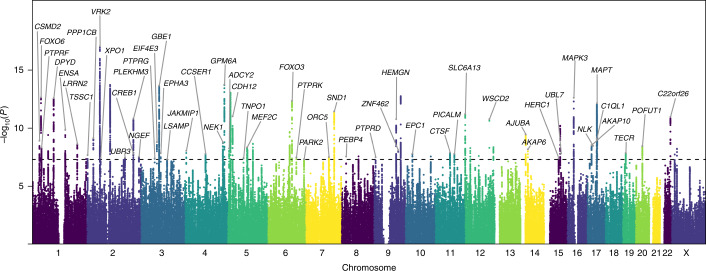
Fig. 2. Manhattan plot of GWAS results of beat synchronization.
Results of GWAS in N = 606,825 participants with 23andMe. The GWAS phenotype is the participants’ responses of Yes (N = 555,660) versus No (N = 51,165) to the question ‘Can you clap in time with a musical beat?’. The GWAS was performed with logistic regression, controlling for age, sex, the top five principal components for ancestry and genotype platform. The x axis shows chromosomal positions, and the y axis shows −log10 P values of the association between the alleles and the phenotype. Sixty-nine loci (70 sentinel SNPs, with one locus containing two independent sentinel SNPs) surpassed the threshold for genome-wide significance of P < 5 × 10⁻⁸ (dashed horizontal line). For illustration purposes, all SNPs with P < 5 × 10⁻⁷ are shown, and SNPs between P = 5 × 10⁻⁷ and 1 were downsampled to an evenly distributed draw of 30,880 SNPs; gene symbols for sentinel SNPs are notated when FUMA provided a gene mapped to the nearest sentinel SNP.

