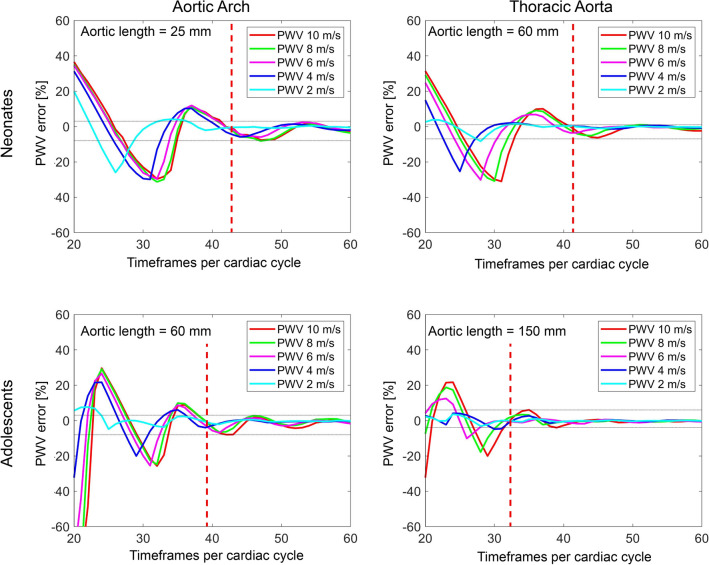
Fig. 5.
Minimum timeframes per cardiac cycle for neonates and adolescents. Computer phantom based on neonatal (top row) and adolescent (bottom row) flow data for aortic lengths 25 mm (top left, i.e., neonatal aortic arch), 60 mm (top right i.e., neonatal thoracic aorta, and bottom left, i.e., adolescent aortic arch), and 150 mm (bottom right, i.e., adolescent thoracic aorta) and for different pulse wave velocities. The aortic lengths presented above approximates the shortest lengths in the current population. Vertical red dashed lines denote the cut-off for required timeframes per cardiac cycle for all pulse wave velocities. Horizontal gray dotted lines denote the mean error (min–max) after the cut-off. For both shorter aortic lengths and higher pulse wave velocities, the required timeframes per cardiac cycle for accurate pulse wave velocity measurements and the pulse wave velocity error at inadequate temporal resolutions increased. X-axis offset between neonatal and adolescent curves is likely related to the shorter diastolic period in neonates due to their higher heartrate

