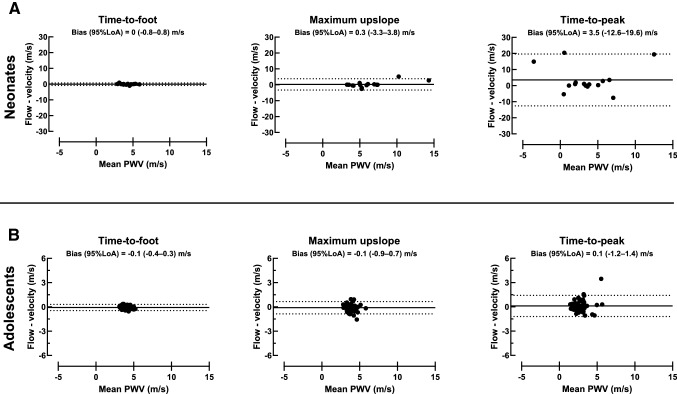
Fig. 9.
Transit time agreement. Bland–Altman plots for neonates (top row) and adolescents (bottom row) with comparison of thoracic aorta velocity and flow-based maximum upslope (left), time-to-foot with automatic baseline correction (middle), and time-to-peak (right) algorithms. For both neonates and adolescents, limits of agreement were narrower for time-to-foot, which may be an indicator of the transit time estimator’s intrinsic robustness. Note the difference in y-axis ranges for neonates and adolescents. Negative PWV values are due to curve shapes with no definitive peak, which worked poorly with the TTP algorithm (c.f. Fig 2). Solid black lines represent bias and dashed lines represent 95% limits of agreement

