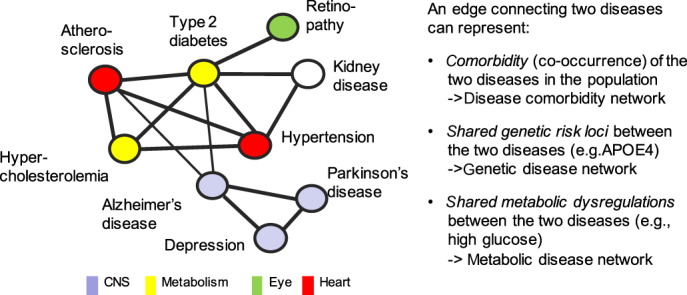
FIGURE 2.

Disease co‐occurrence networks. Disease networks depict and combine pairwise relationships between diseases and allow visualization and analysis of more complex interrelationships between multiple diseases. While each node represents a disease or disease phenotype, an edge between two diseases can represent different types of relationships in different types of disease networks; depicted relationships can range from mere comorbidity (co‐occurrence) of the two diseases as observed in the population (comorbidity network) to molecular links (e.g., genetic, metabolic) between the diseases, derived from omics studies (genetic disease network; metabolic disease network). For example, the APOE‐ε4 genotype, a genetic risk factor for both Alzheimer's diseases and for atherosclerosis, suggests shared aspects in pathomechanisms.
