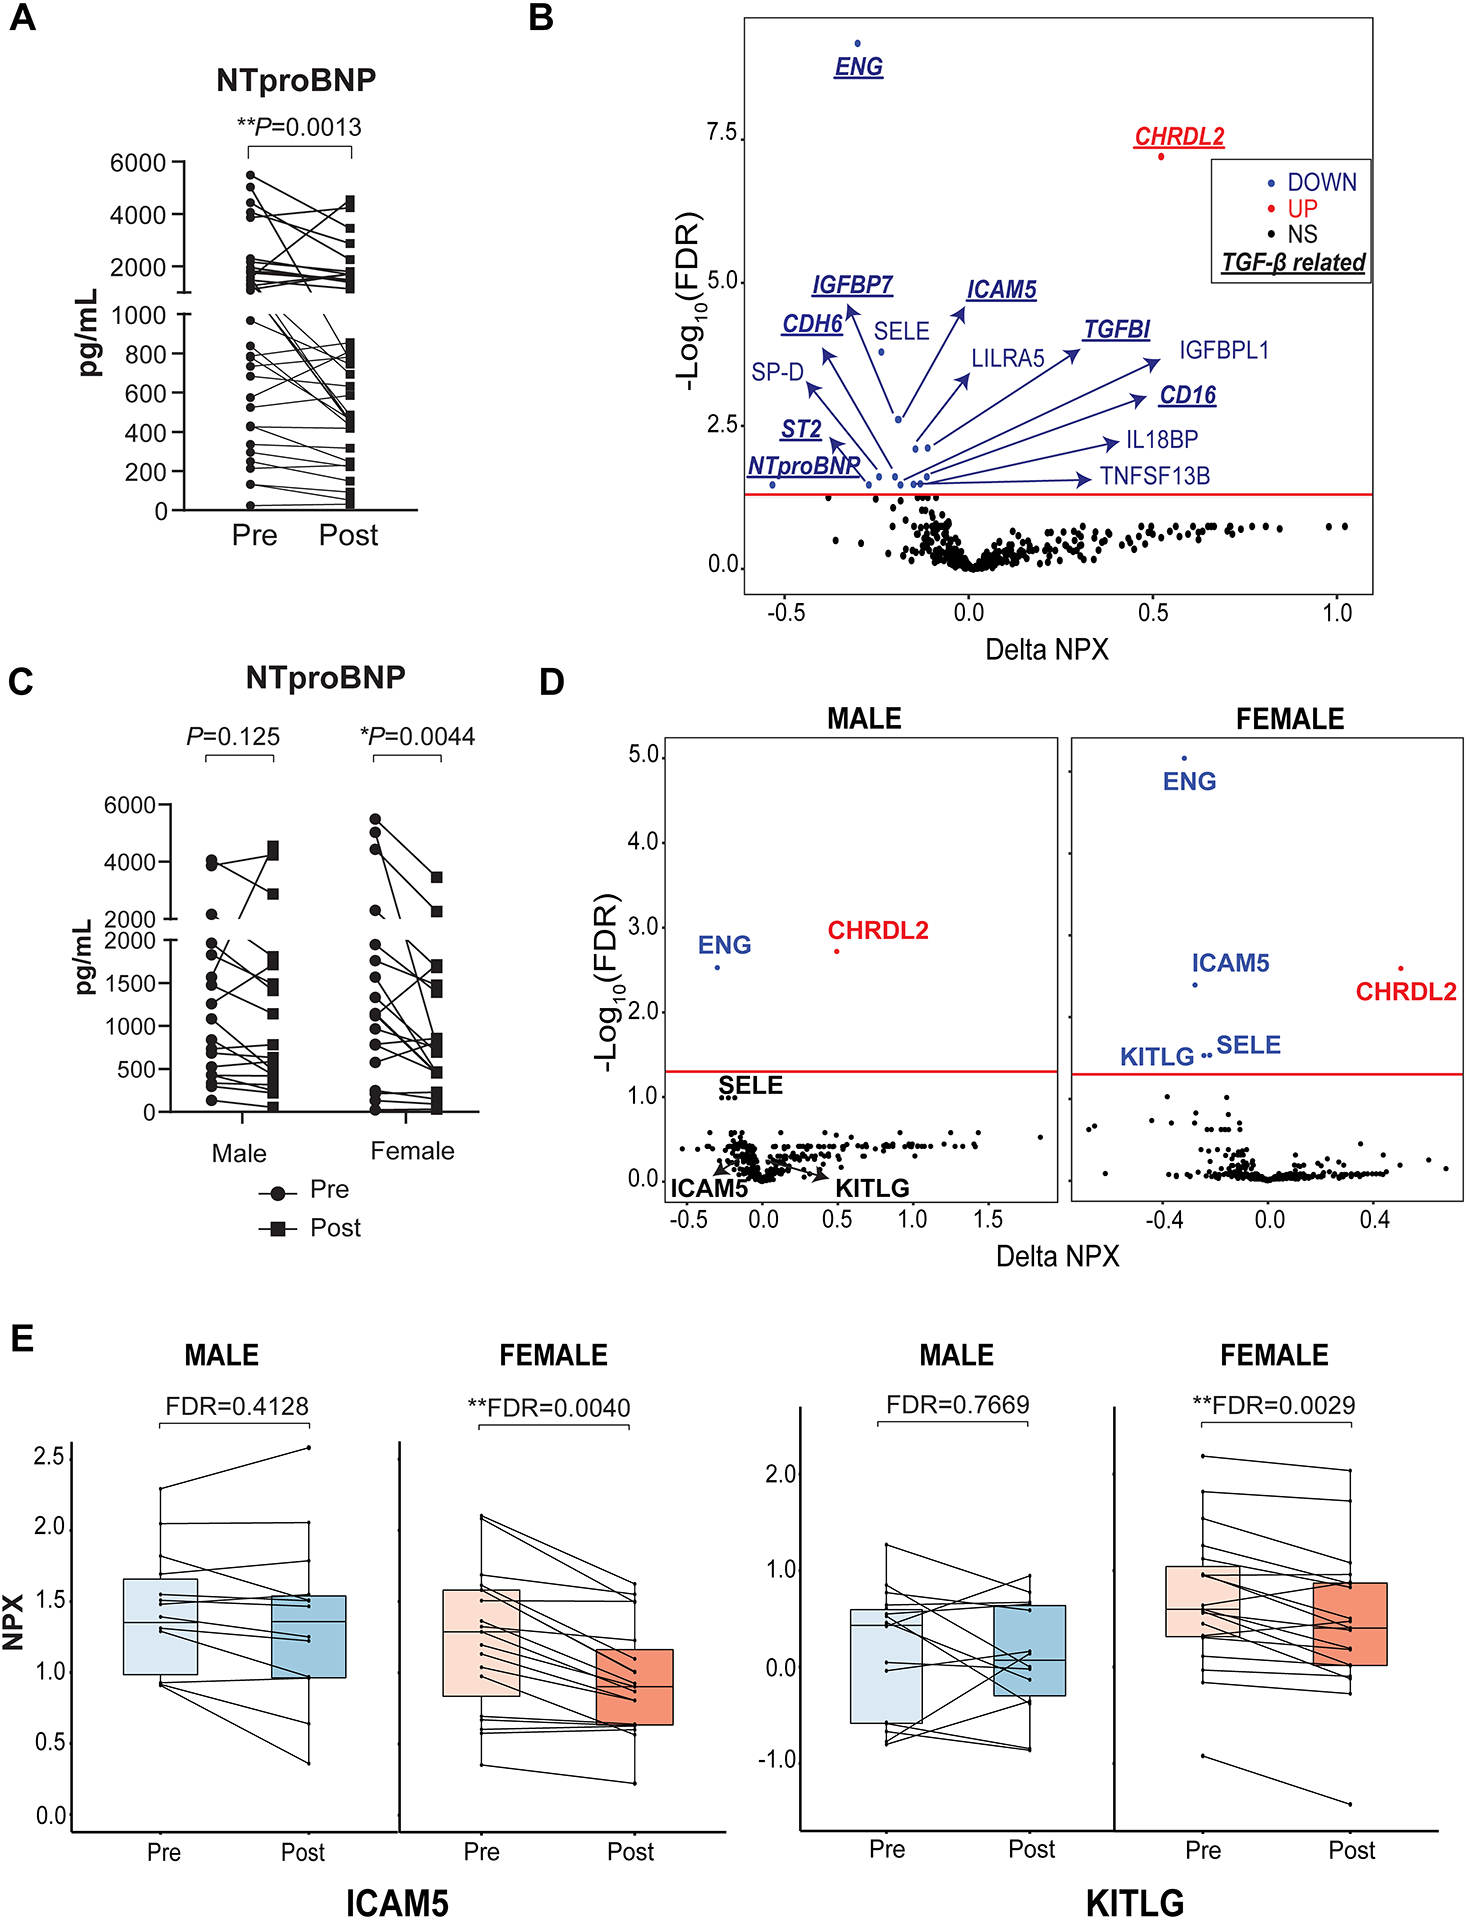
Proteomic profiling of HFpEF patients prior to and after 5 weeks of sacubitril/valsartan treatment.

(A) Plasma level of NTproBNP in all patients before and after drug treatment measured by standard clinical electrochemiluminescence immunoassay. P-value reflected paired t-test of log2-transformed values. (B) Volcano plot of proteomic changes before and after 5 weeks of sacubitril/valsartan treatment (paired student’s t-test with Benjamini–Hochberg multiple comparison correction. All proteomic analyses were done with R version 4.1.1). Y axis represents -log 10 of false discovery rate (FDR). X axis represents Normalized Protein Expression (NPX) change. Red line in the plot represents significant cutoff at 5% FDR. (C) Plasma level of NTproBNP in female and male patients before and after drug treatment measured by standard clinical electrochemiluminescence immunoassay (P-value reflected paired t-test of log2-transformed values). (D) Volcano plot of changes before and after 5 weeks of sacubitril/valsartan treatment stratified by sex (paired student’s t-test with Benjamini–Hochberg multiple comparison correction). Y axis represents -log10 of FDR. X axis represents NPX change. Red line in the plot represents significant cutoff at 5% FDR. Because SELE showed a trend of being changed by sacubitril/valsartan in male patients, it was conservatively not considered female-specific response and not discussed in the main text. (E) Two proteins changed after sacubitril/valsartan treatment that were female specific. Each dot represents a patient.
