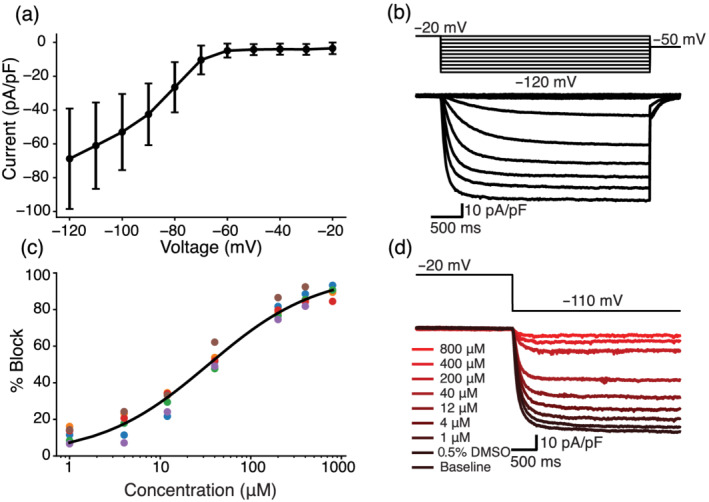
FIGURE 7.

Dose–response curve shows quinine block of funny current in HEK‐293 cells stably expressing HCN1. (a) IV curve with averages and errors calculated from six HEK‐HCN1 cells. (b) Representative HEK‐HCN1 current–voltage traces. (c) Dose–response curve fit to pharmacology data from six HEK‐HCN1 cells. (d) Traces generated from a representative cell by clamping at −20 mV for 3000 ms, and then stepping to −110 mV for 3500 ms at all tested concentrations
