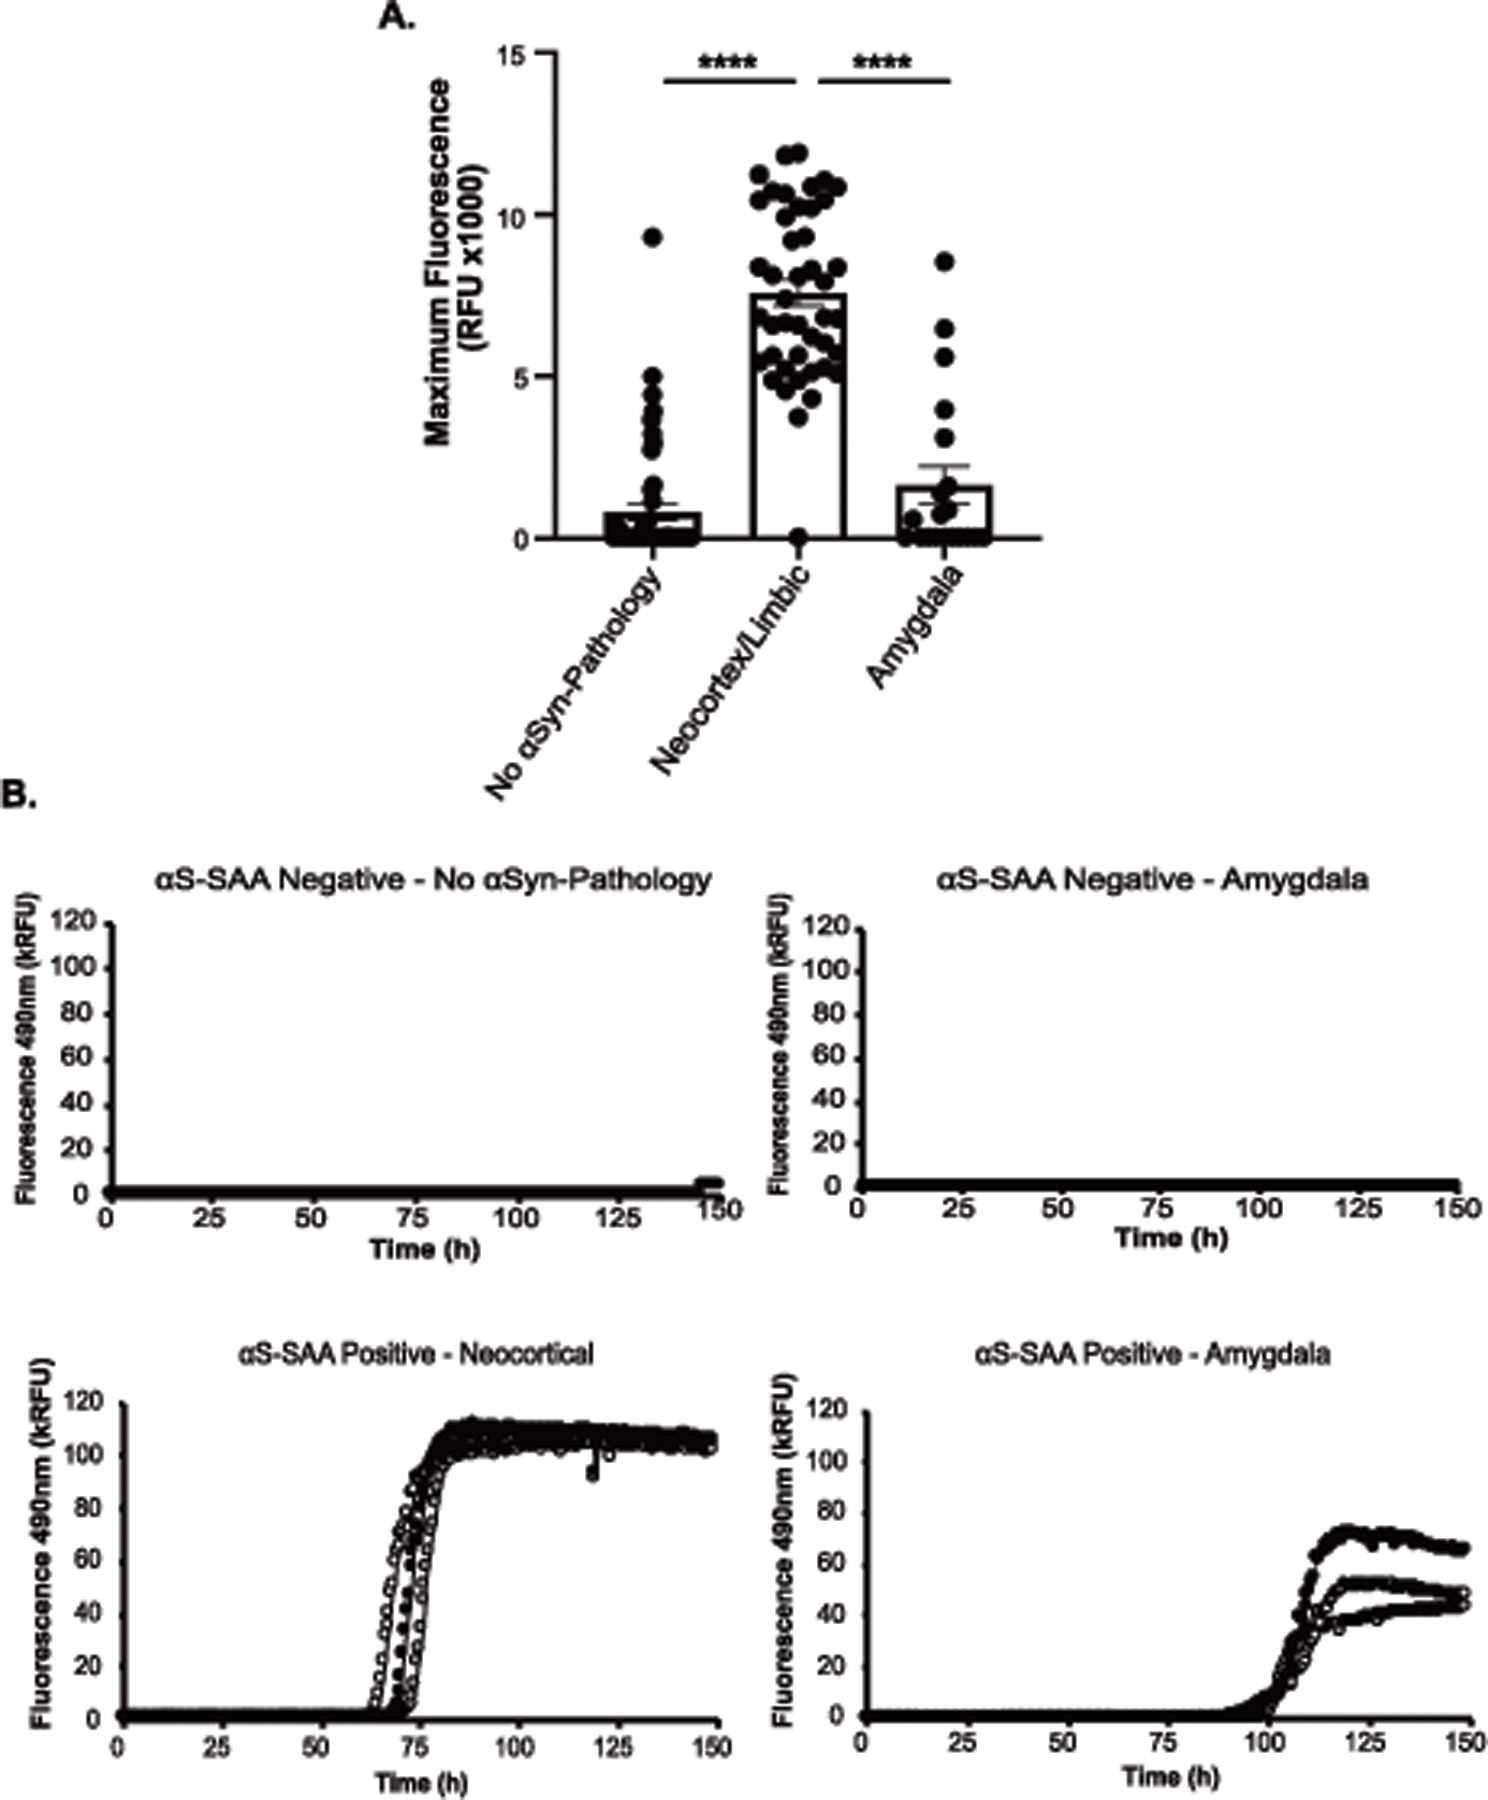
Figure 1. Kinetic parameters of Research SAA stratified by alpha-synuclein distribution.

A) Maximum Fluorescence Signal from R/D αSyn-SAA using antemortem CSF between no αSyn-pathology (n=51), Neocortex/Limbic (n=44), and Amygdala-predominant (n=21) groups. B) Representative figures of raw kinetic data from the Research SAA using antemortem CSF. Included are “negative” samples that are from no αSyn-pathology and amygdala-predominant individuals, and “positive” samples that are from neocortical and amygdala-predominant individuals. Statistical analysis using one-way ANOVA with Tukey’s multiple comparisons post hoc (A). Error bars represent Standard Error of the Mean (SEM).
