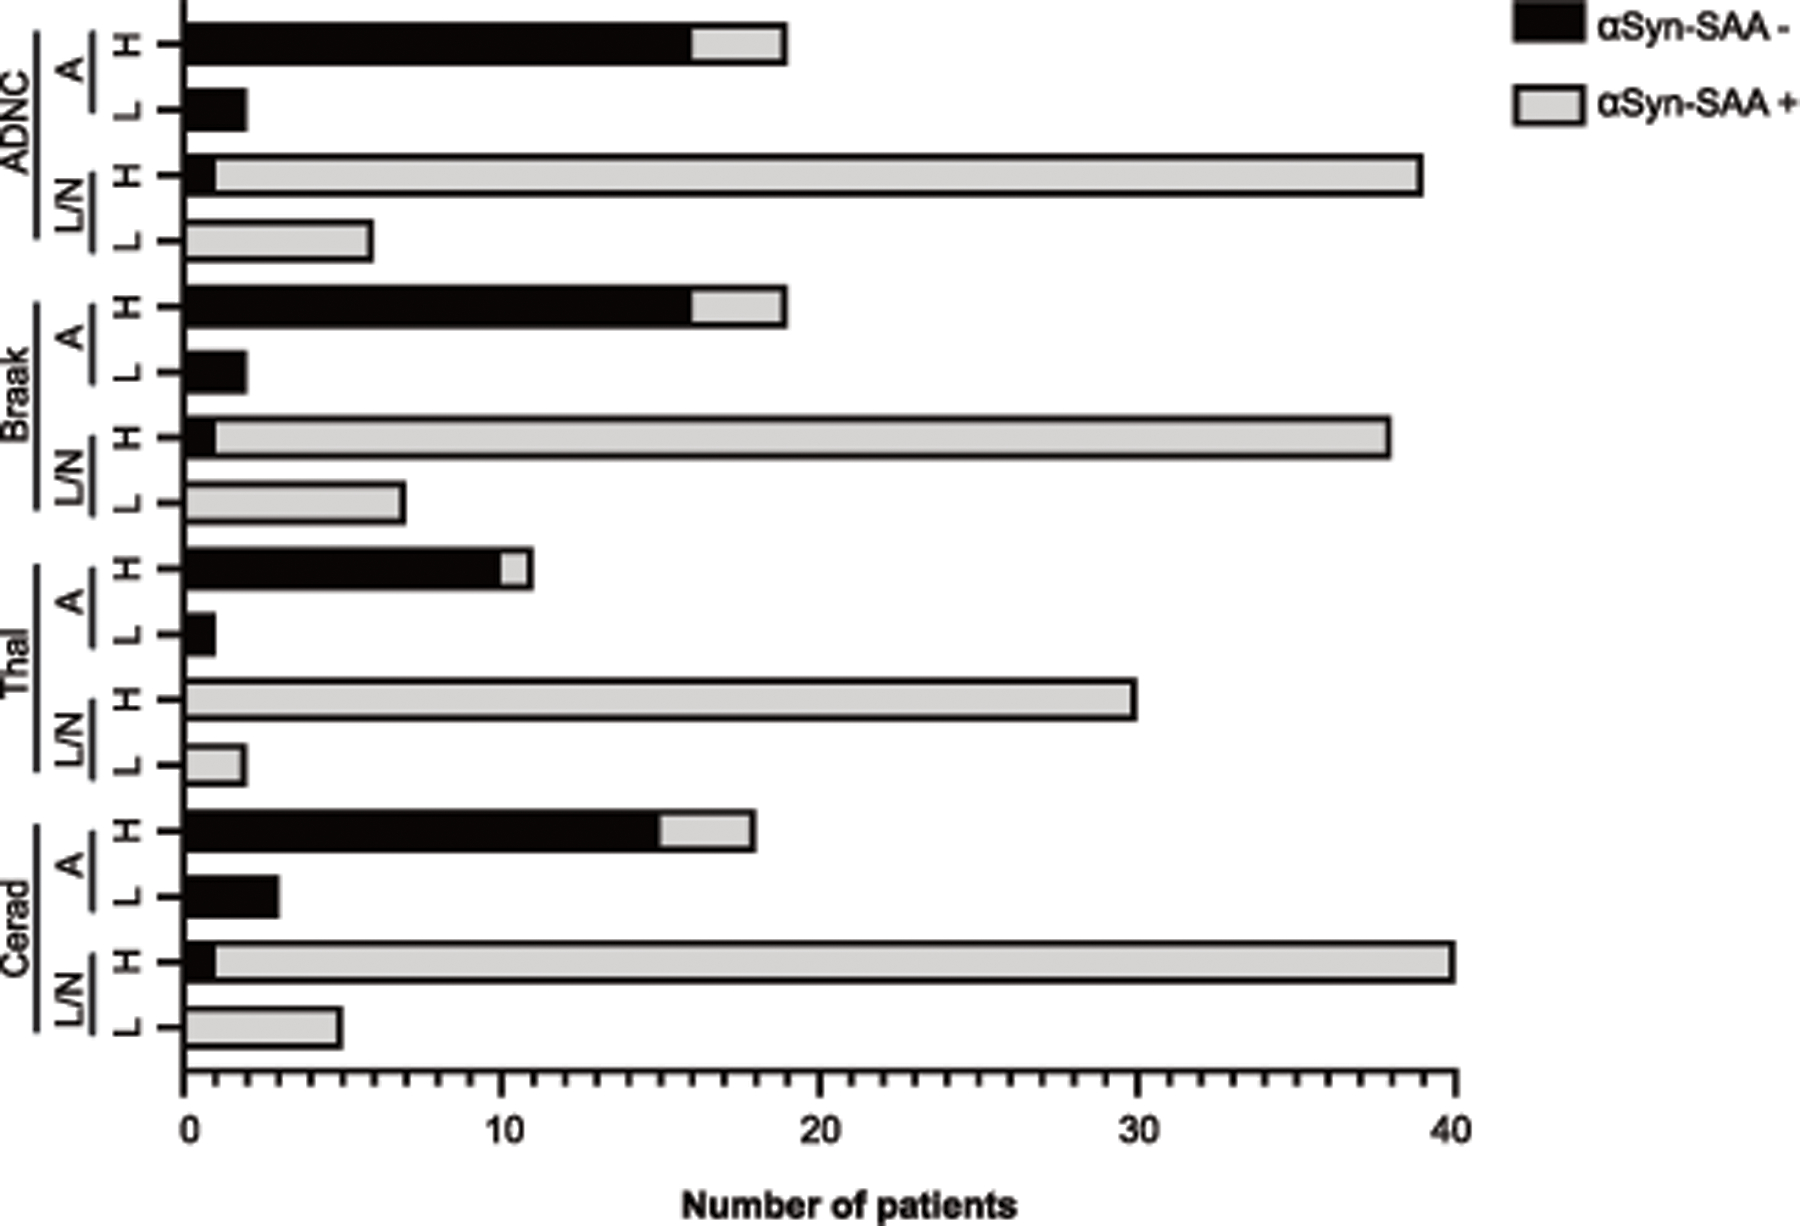
Figure 2. Differences in neuropathology scores between synuclein-pathology groups as a function of SAA result.

Bars represent the distribution of SAA positive or SAA negative within high (“H”) or low (“L”) categorization of ADNC, Braak, Thal, and Cerad neuropathological staging. Patients are further classified by limbic/neocortical (“L/N”) or amygdala-predominant (“A”) groups. Statistical analysis using Fisher’s exact test within synuclein-pathology group.
