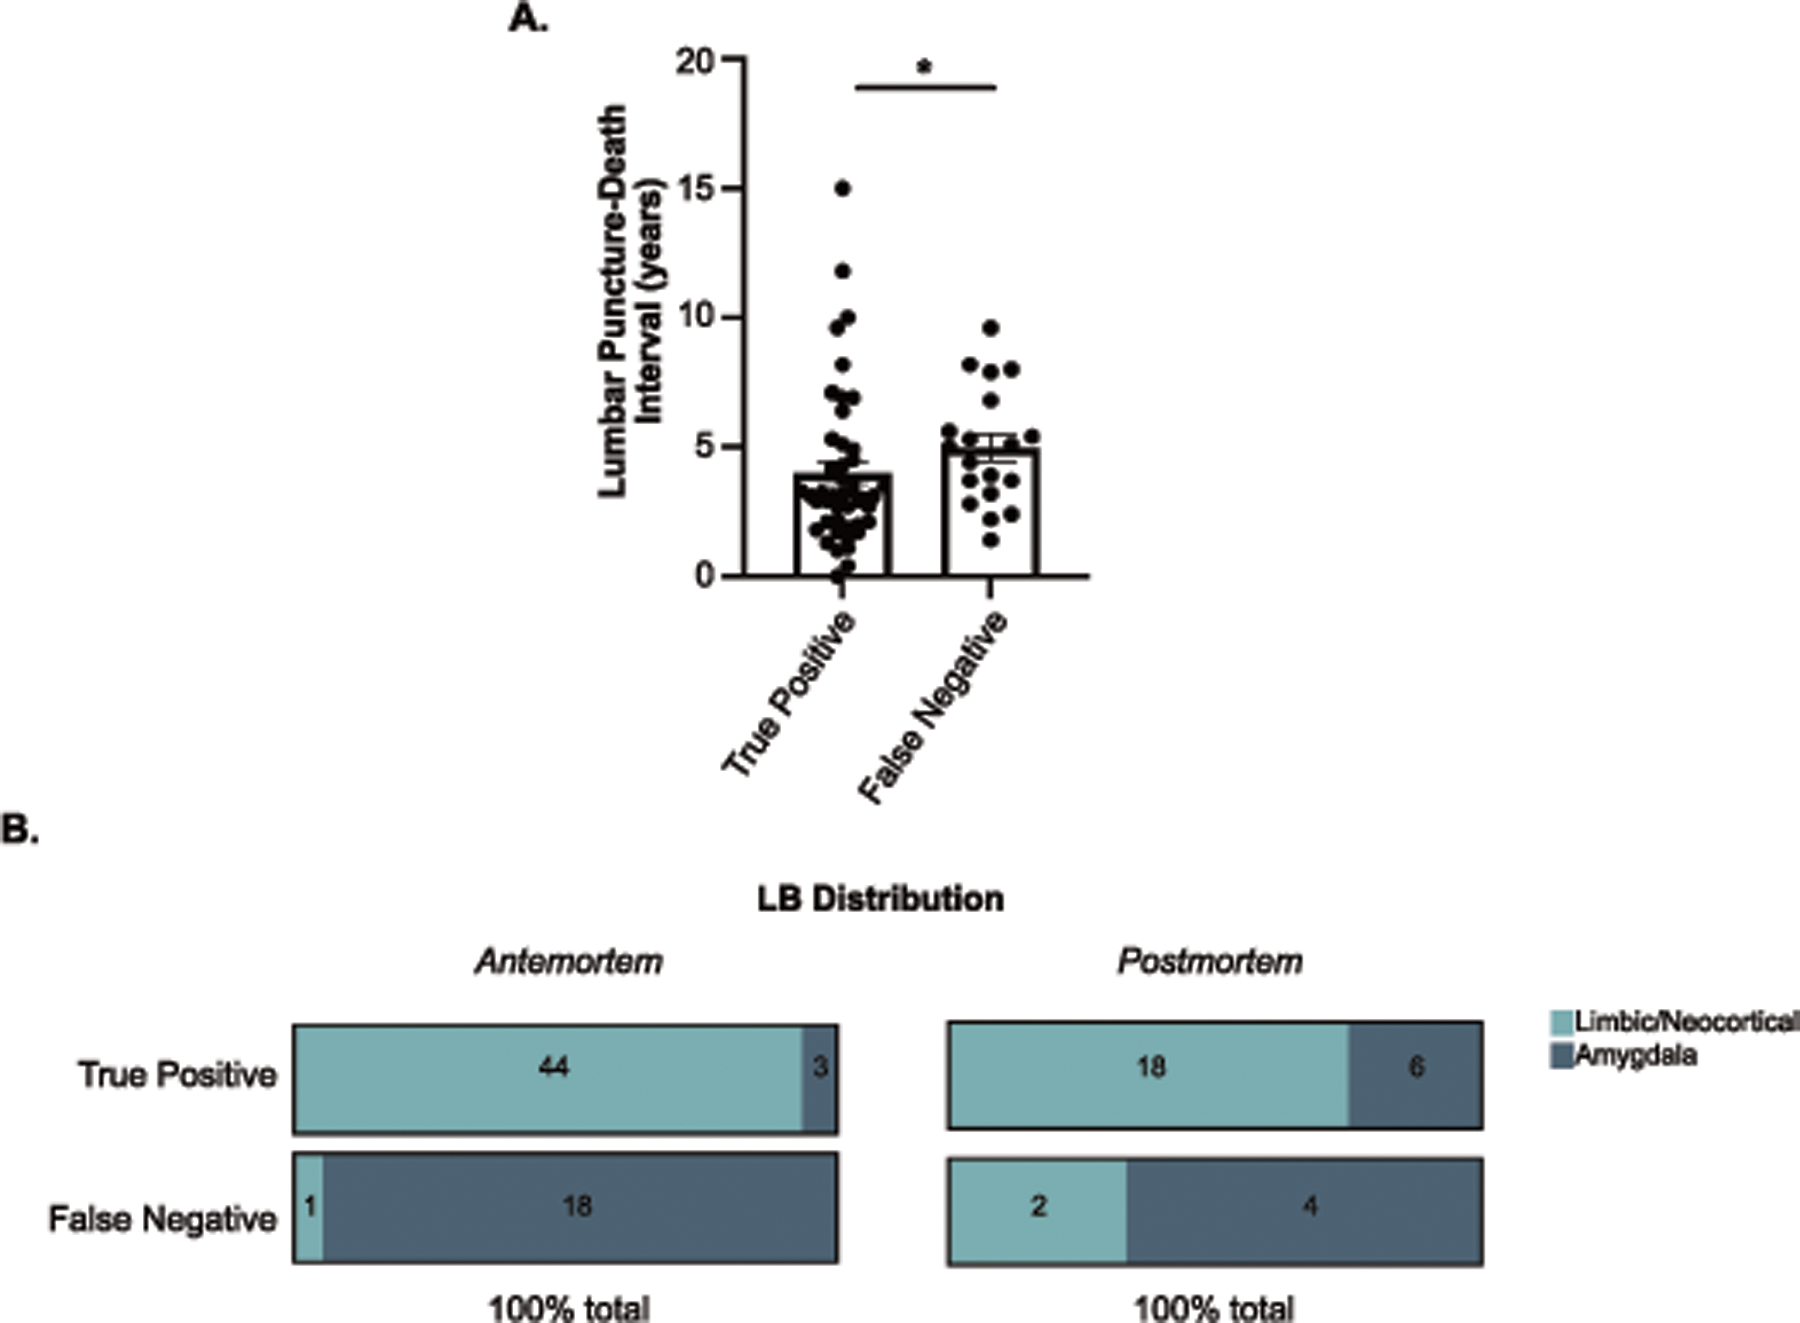
Figure 3. Clinical and pathological differences between True Positive and False Negative.

A) Interval in years from lumbar puncture to death between True Positives (n=47) and False Negative (n=19) groups. B) Distribution of Neocortex/Limbic and Amygdala-predominant LRP in True Positive and False Negative groups for antemortem and postmortem CSF analysis. Number of patients in each category is indicated on the bar. Statistical analysis using Wilcoxon rank-sum test with post hoc pairwise comparisons from Dwass, Steel, Critchlow-Fligner method (A) or chi-square (B). Error bars represent Standard Error of the Mean (SEM).
