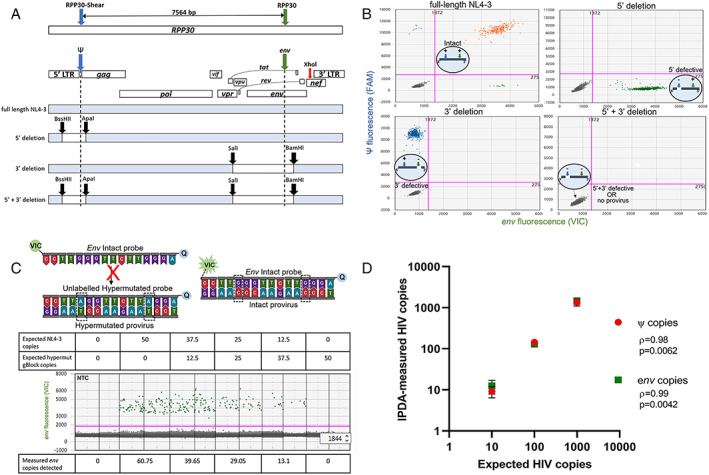
FIGURE 2.

Validation of IPDA specificity. (A) Primer binding map for HIV Ψ (blue), HIV env (green) and RPP30 (blue and green arrows; same spacing as the Ψ and env amplicons (7,564 bp) to correct for DNA shearing in a separate multiplex ddPCR). XhoI (red arrow) binding site for gDNA digestion for the IPDA is shown. Maps of NL4‐3 plasmid controls including restriction enzyme cut sites (black arrow): (i) full‐length NL4‐3, (ii) 5′ deletion, (iii) 3′ deletion, or (iv) 5′ + 3′ deletion. (B) Representative IPDA 2D‐amplitude plots using 1,000 DNA copies of NL4‐3 plasmid controls shown in A assayed on a background of PBMC gDNA from HIV seronegative donor. Intact (HIV Ψ + and env+; orange), 5′ deleted (HIV env + only; green), 3′ deleted (HIV Ψ + only, blue), and 5′ + 3′ deleted NL4‐3 plasmid controls (HIV ψ‐ and env‐; grey). Bottom left quadrants also represents droplets with no provirus. (C) Map of env probes specific for the RRE region consisting of 2 adjacent G‐>A APOBEC3G sites (dashed boxes). An unlabeled hypermutated competitor probe preferentially binds to hypermutated proviruses, preventing the binding of the VIC‐labelled intact probe, which only hybridizes to intact proviruses to release fluorescent signal away from 3′ minor‐groove binder quencher (Q). Specificity of the env probes was validated using varying copies of HIV NL4‐3 spiked with a synthetic gBlock fragment of a hypermutated env sequence (average env copies from n = 3 experiments shown). (D) Correlative analysis of expected and IPDA‐measured frequencies of ψ and env copies of HIV. The gDNA from PBMCs of HIV seronegative donors was spiked with cell equivalent concentrations of ACH‐2 cells and subjected to the IPDA. Nonparametric Pearson's rho and significant p values (p < 0.05) shown. There were 3 experiments performed. ddPCR = droplet digital polymerase chain reaction; IPDA = intact proviral DNA assay; NNTC = National NeuroAIDS Tissue Consortium; PBMC = peripheral blood mononuclear cell; RRE = Rev response element.
