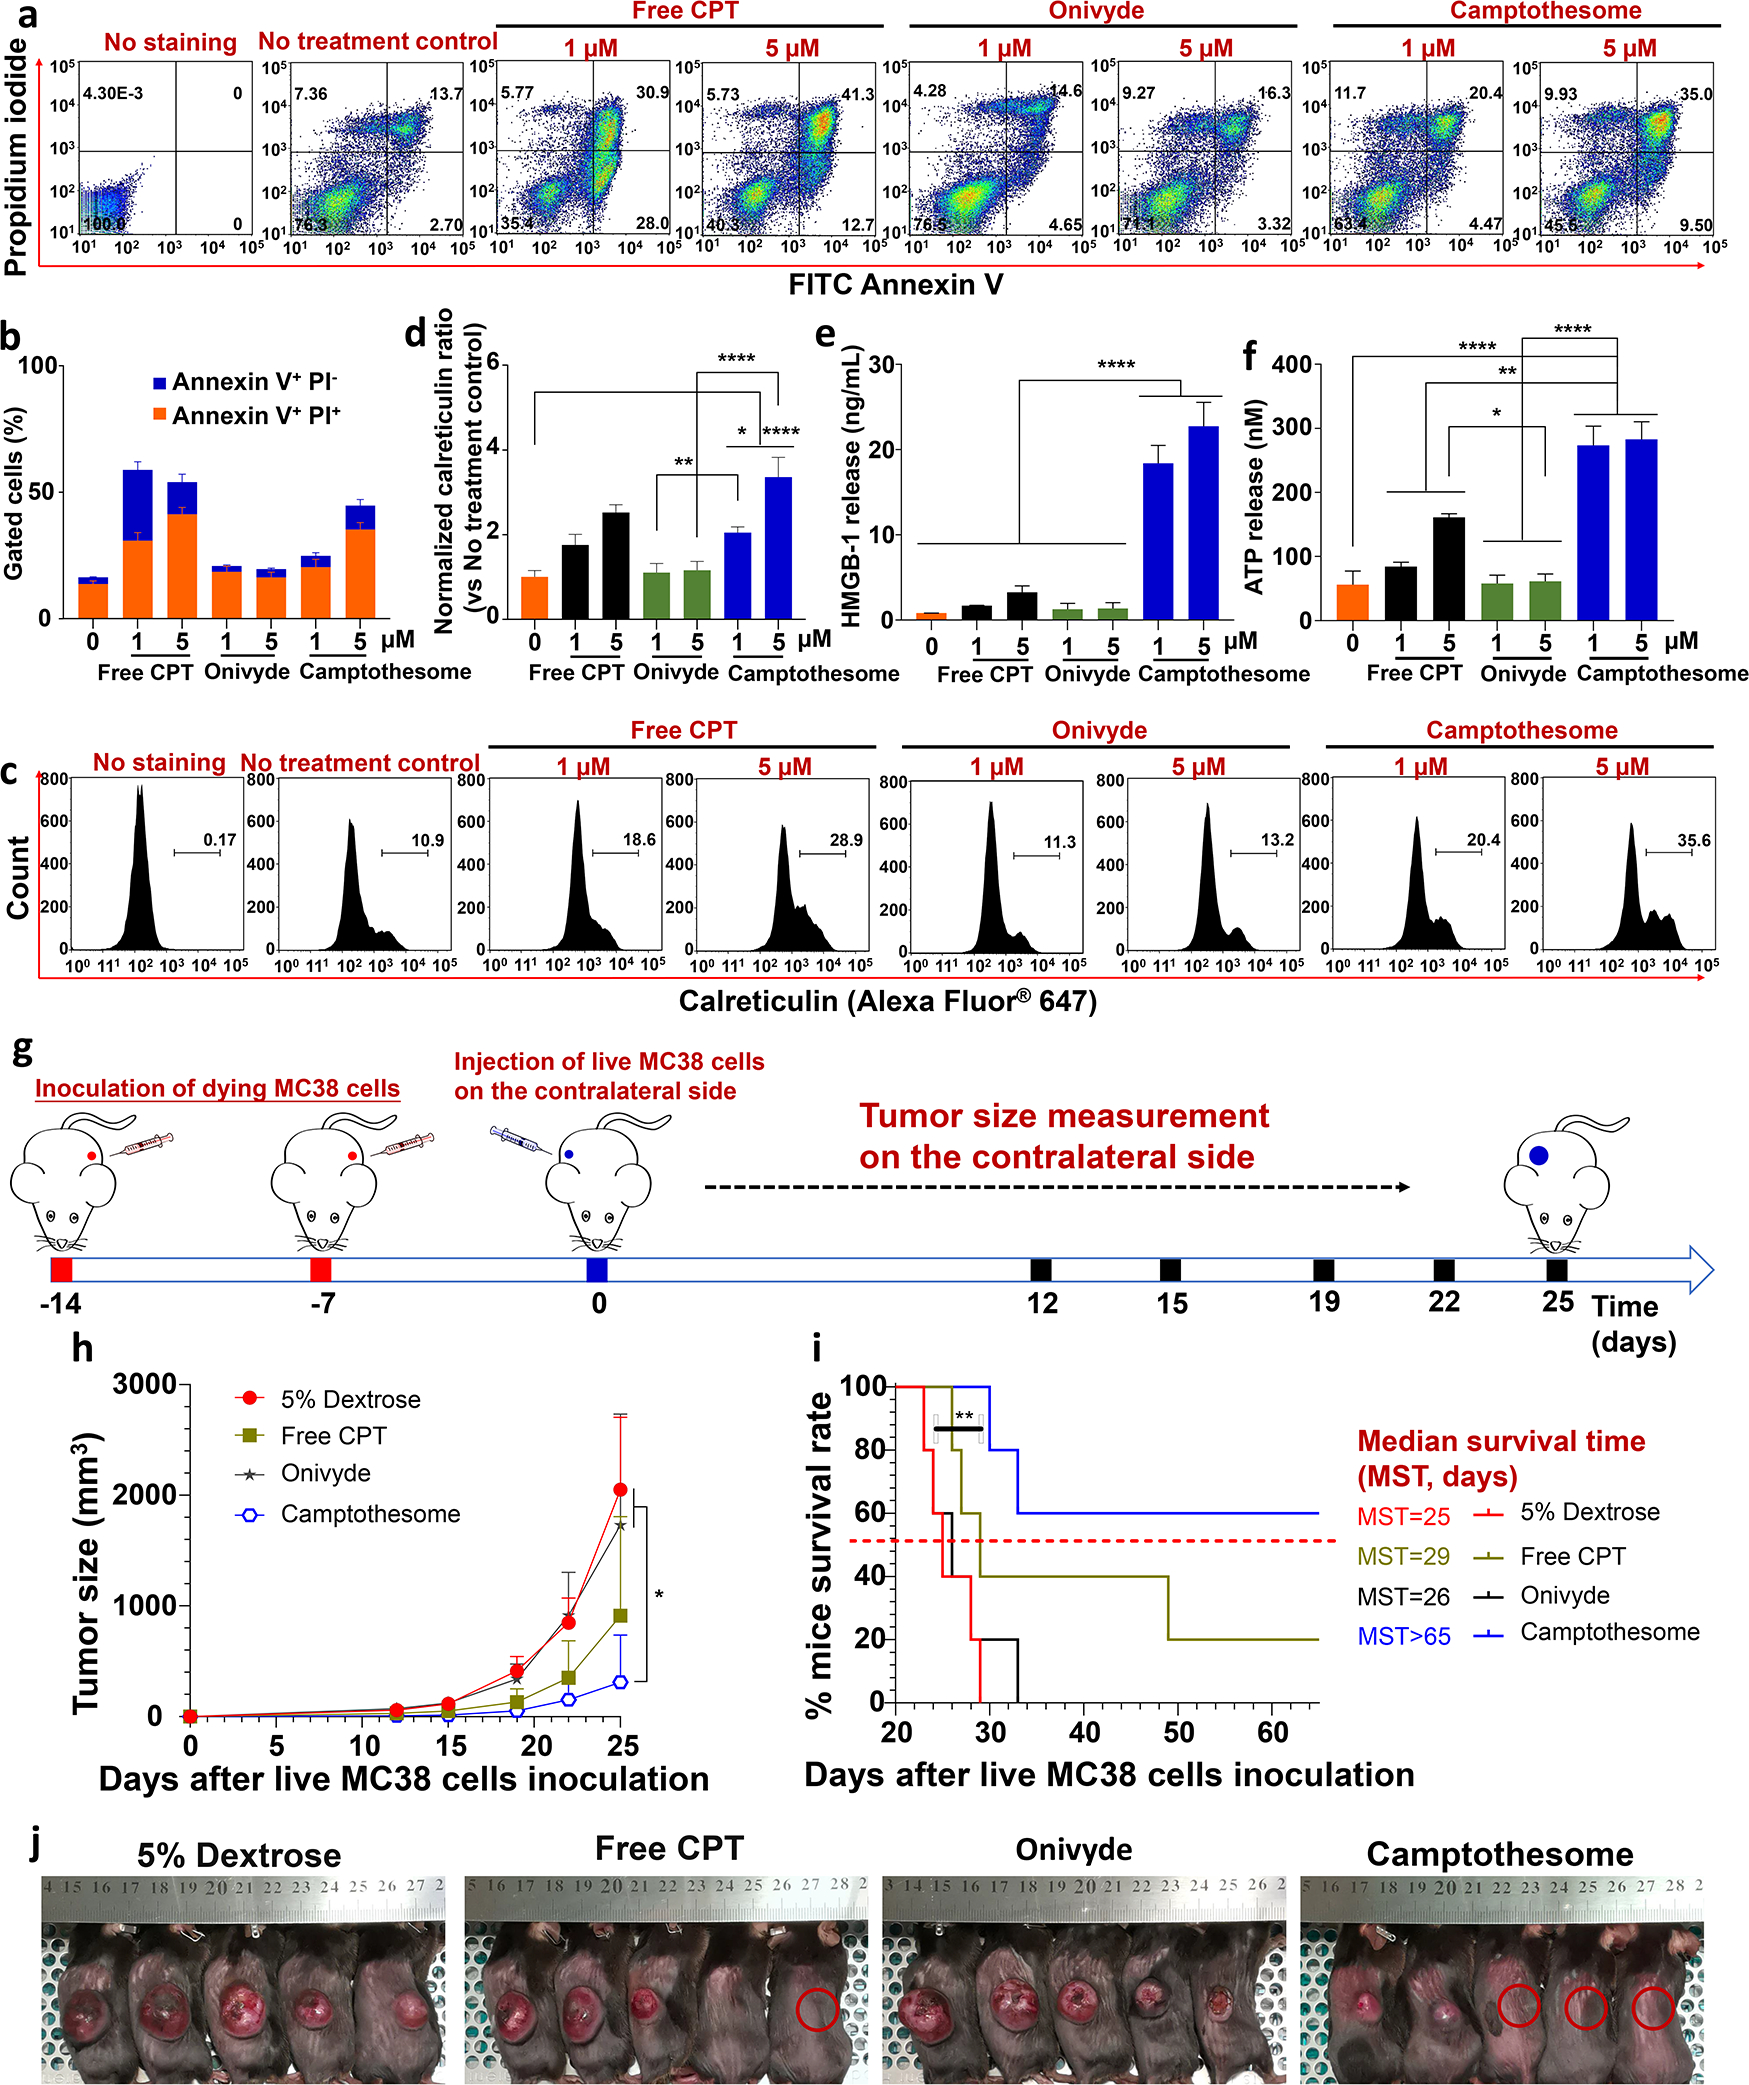
Fig. 2. Camptothesome elicits robust ICD response in CRC.

(a) Flow cytometry determination of the apoptotic and necrotic MC38 cells by FITC Annexin V and propidium iodide (PI) after 20 h of treatment with free CPT, Onivyde and Camptothesome at 1 μM or 5 μM of equivalent CPT, respectively. (b) Frequency of early apoptotic (Annexin V+ PI−) and necrotic/late apoptotic (Annexin V+ PI+) MC38 cells. (c) Flow cytometry of the calreticulin expression on MC38 cells induced by free CPT, Onivyde or Camptothesome for 20 h at 1 μM or 5 μM of equivalent CPT, respectively. (d) Normalized calreticulin expression ratio as compared to no treatment control. (e, f) The released HMGB-1 (e) and ATP (f) concentrations in the medium of samples in (c), respectively. Data are expressed as mean ± s.d. (n = 3). (g-i) Vaccination approach to validate the ICD potential of Camptothesome in vivo. (g) Cartoon to show that mice received 2 times (one week apart) of subcutaneous injections of dying MC38 cells (1 × 10⁶) induced by free CPT, Onivyde or Camptothesome at 5 μM of equivalent CPT for 20 h. On day 0, Mice were inoculated with live MC38 cells subcutaneously on the contralateral flank and tumor development was monitored as indicated. (h) Tumor growth curves to show the MC38 tumors developed on the contralateral side. Data are expressed as mean ± s.d. (n = 5). (i) Kaplan-Meier survival curves. (j) Tumor-bearing mice images were taken on day 25. Red circle: tumor-free mouse. Statistical significance was determined by one-way ANOVA followed by Tukey’s multiple comparisons test; survival curves were compared by the log-rank Mantel–Cox test. *P < 0.05, **P < 0.01, ****P < 0.0001. (For interpretation of the references to colour in this figure legend, the reader is referred to the web version of this article.)
