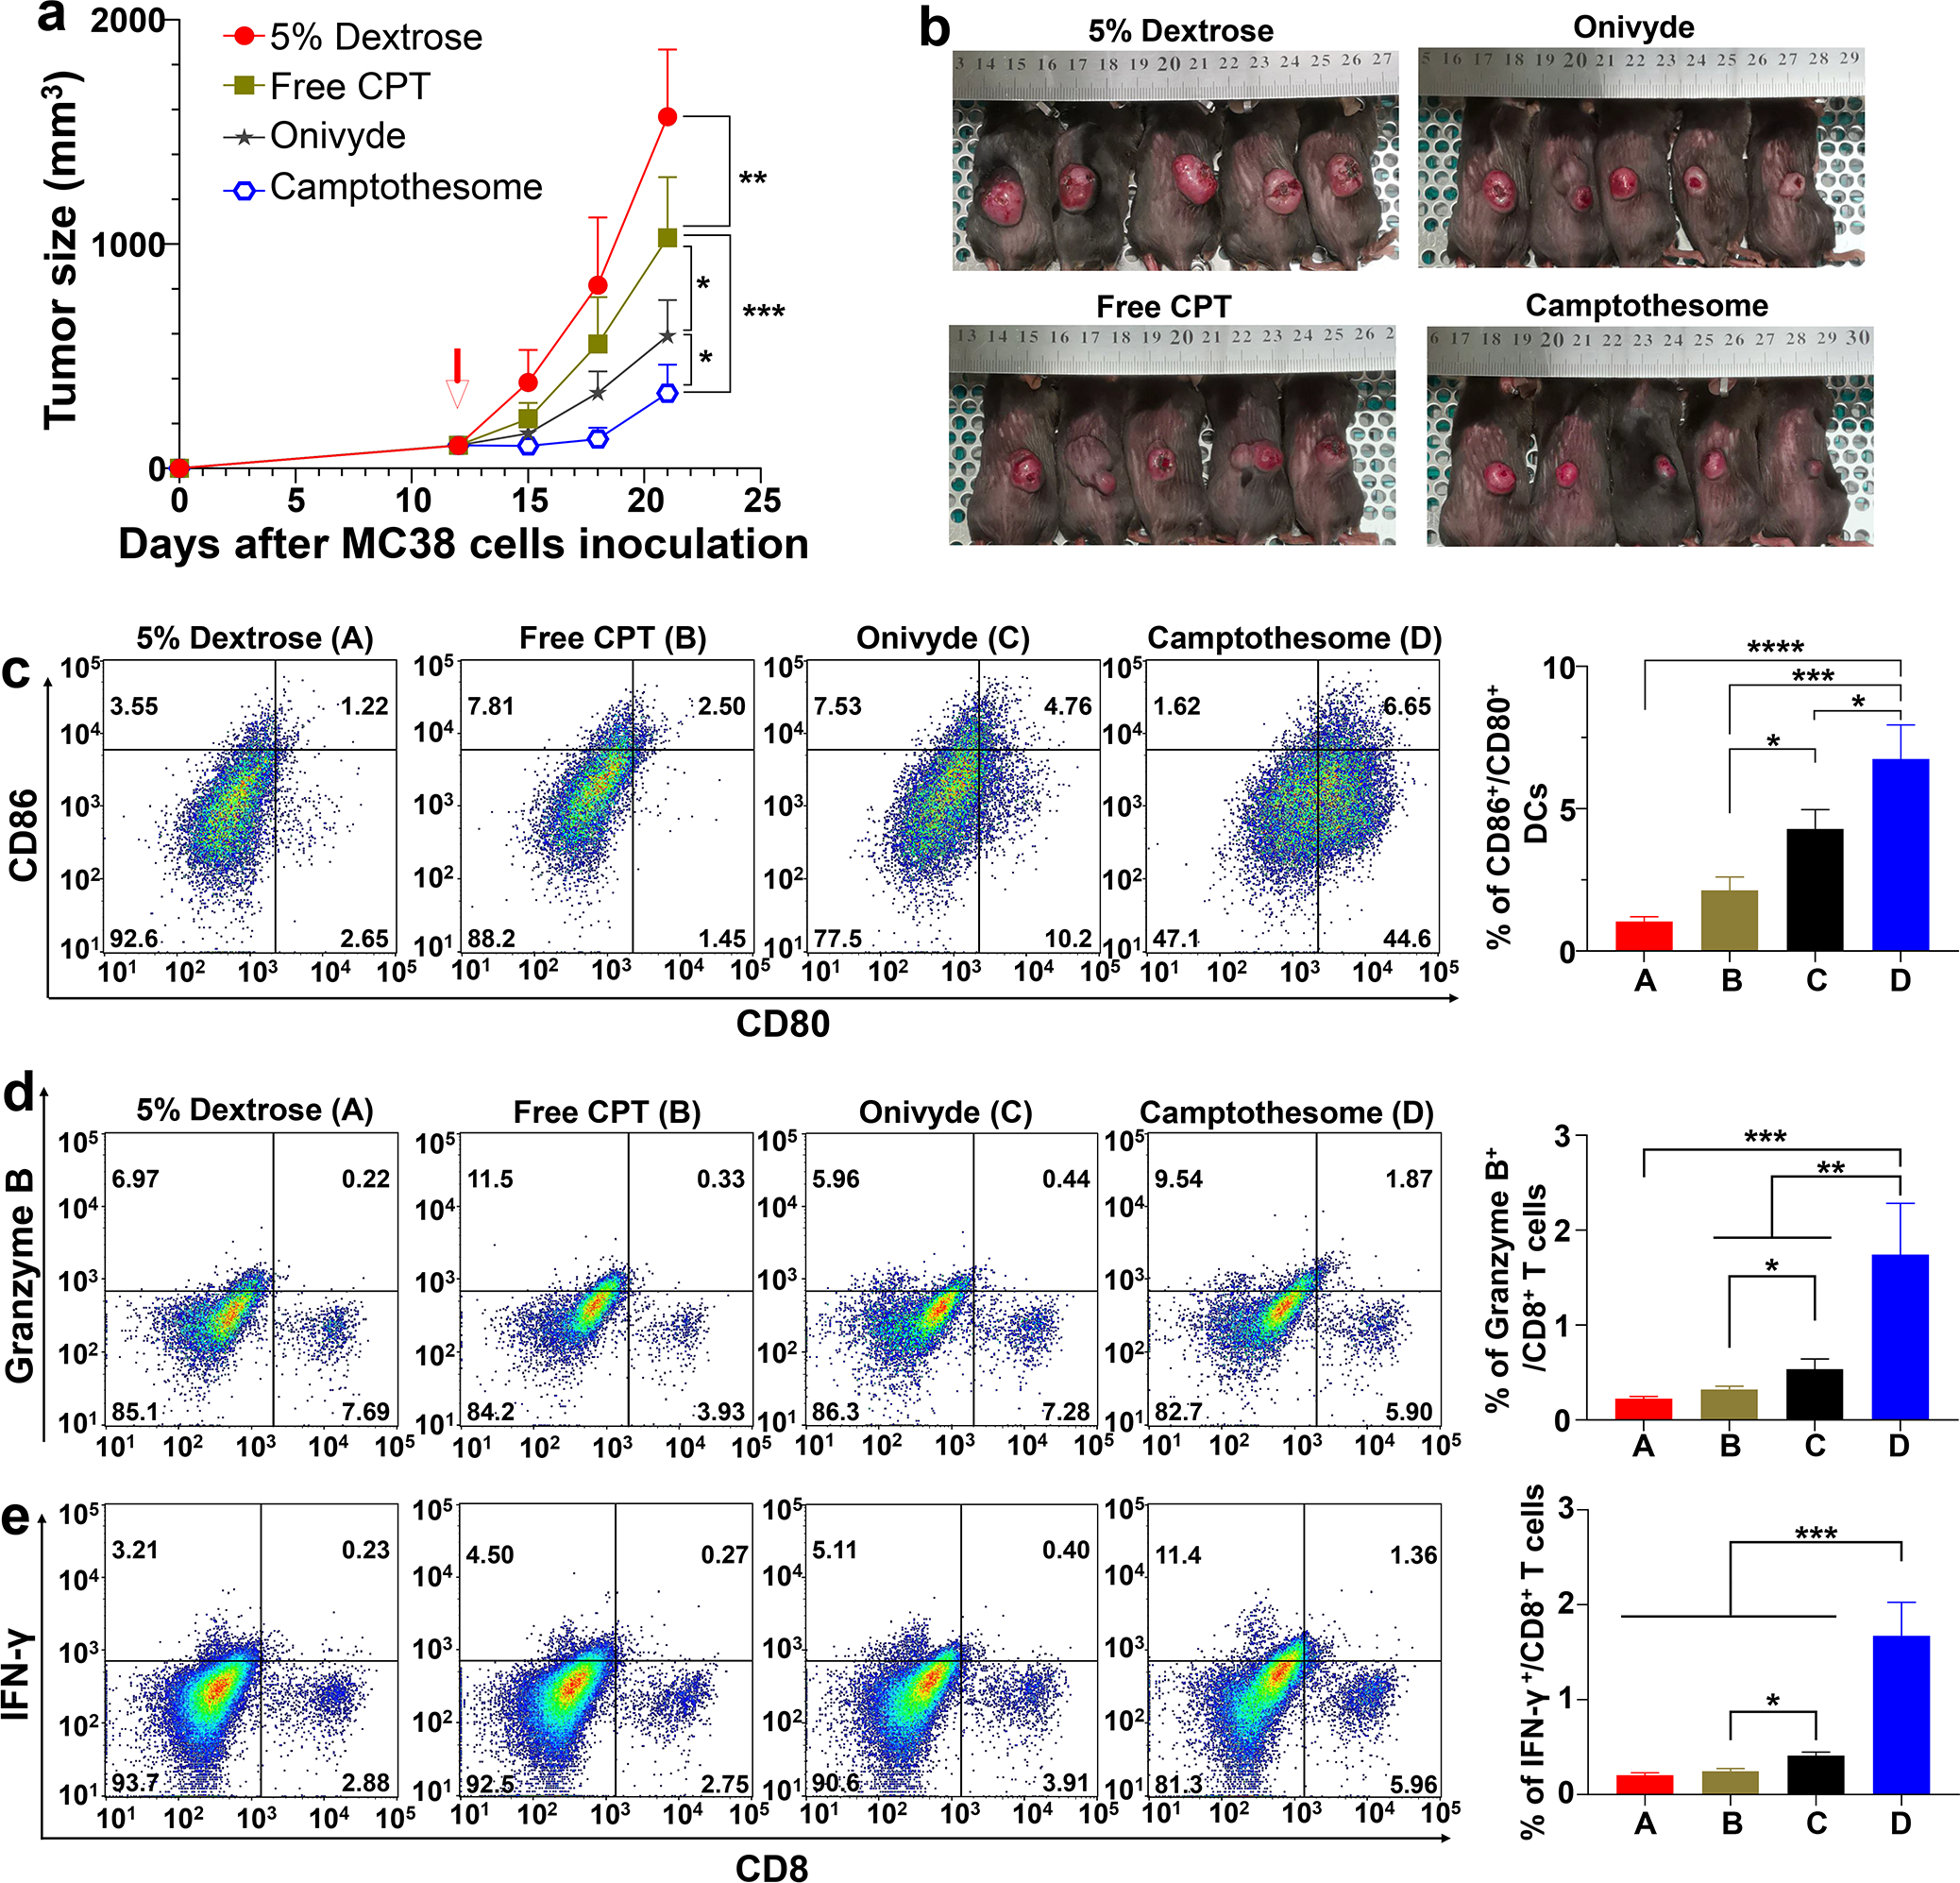
Fig. 4. Camptothesome beats Onivyde on anti-CRC efficacy and immune responses.

(a) Tumor growth curves in subcutaneous MC38 tumor-bearing mice (tumors: ~100 mm3) that were intravenously injected once by free CPT, Camptothesome or Onivyde (8.4 mg irinotecan/kg) at equivalent 5 mg CPT/kg (MTD of free CPT) on day 12. 5% Dextrose was vehicle control. Data are presented as mean ± s.d. (n= 5). (b) Tumor-bearing mice images were taken on day 21. (c-e) Representative flow cytometric plots of intratumoural CD80+/CD86+ DCs (c), Granzyme B+/CD8+ T cells (d), and IFN-γ+/CD8+ T cells (e), and respective quantitative analysis (right panel). Data are presented as mean ± s.d. (n= 3, the tumors were randomly chosen from a on day 21). Statistical significance was determined by one-way ANOVA followed by Tukey’s multiple comparisons test. *P < 0.05, **P < 0.01, ***P < 0.001, ****P < 0.0001.
