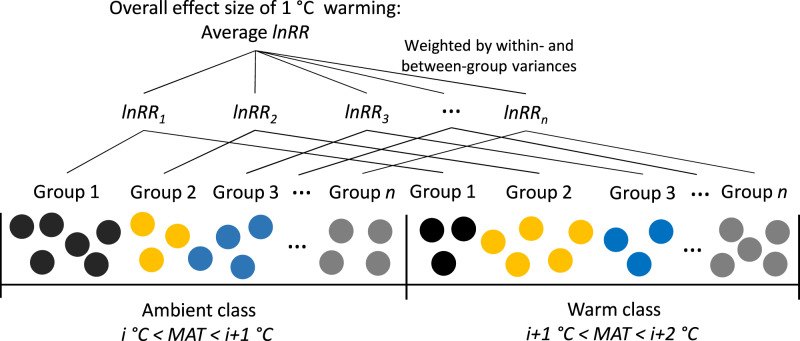
Fig. 1. Schematic representation of the approach used to quantify the response of soil organic carbon (SOC) to warming.
Each dot represents one soil profile. Dots with the same colour indicate that they share the same mean annual precipitation, precipitation seasonality, landform and soil type, and are grouped into classes distinguished by mean annual temperature (MAT). Depending on the interest of warming level (e.g., 1 °C in this schematic example), two classes (i.e., an ambient class and a warm class) are selected and SOC measurements (content and stock) from soil profiles belong to the same group are compared between ambient and warm classes (e.g., group 1 in ambient class vs group 1 in warm class). Meta-analytic techniques are applied to calculate the effect size for each comparison (i.e., the log response ratio lnRR), and a weighted average effect size by the inverse of the sum of within- and between-group variances is estimated.

