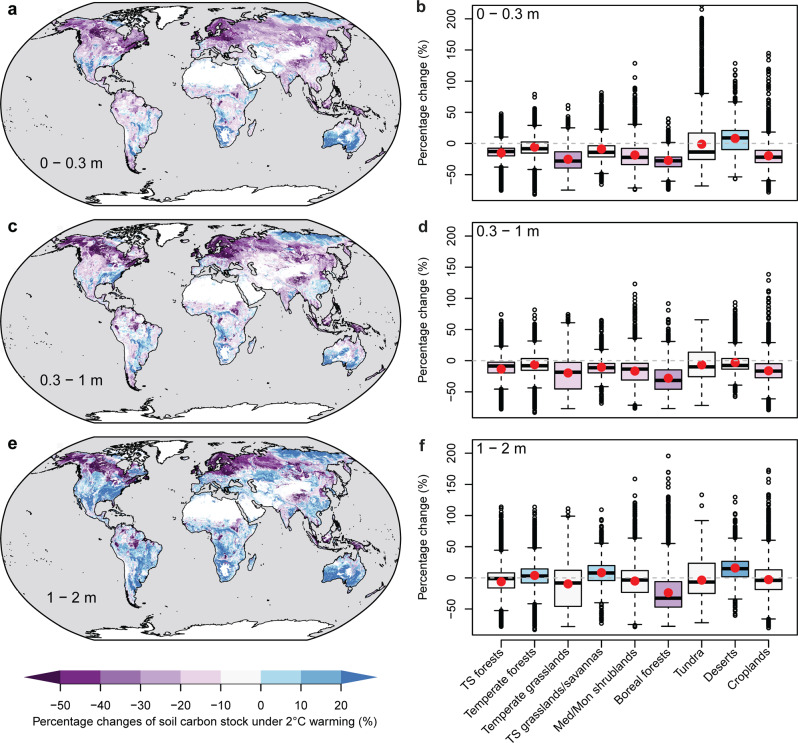
Fig. 5. Global pattern of percentage changes of soil organic carbon (SOC) stocks under 2 °C warming.
Top, middle and bottom panels: three soil layer depths (i.e., 0–0.3, 0.3–1, 1–2 m), respectively. Left panels: maps of the spatial distribution of the changes; right panels, aggregated by biome types. In b, d, f, the red points are the average value in each biome; boxplots show the median and interquartile, with whiskers extending to the most extreme data point within 1.5×interquartile range. The maps are produced by applying machine learning-based meta-forest models constrained by the global soil profiles across the globe at the resolution of 1 km. Uncertainties in the mapped changes have been presented in Supplementary Fig. 9. The global SOC map of WISE is used for current standing SOC stocks. TS forests, tropical/subtropical forests; Med/Mon shrublands, Mediterranean/montane shrublands; TS grasslands/savannas, tropical/subtropical grasslands/savannas.

