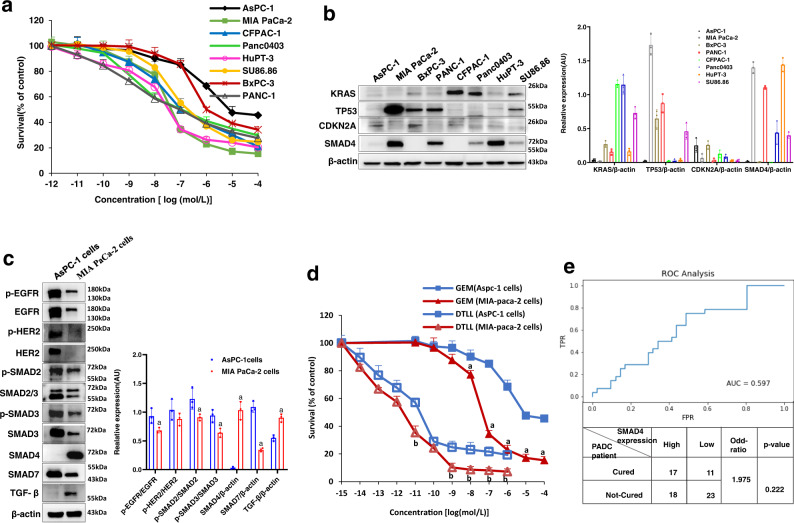
Fig. 1. Differences in drug susceptibility and PDAC drivers between AsPC-1 cells and MIA PaCa-2 cells.
a Drug responses to gemcitabine of eight human pancreatic cancer cell lines. AsPC-1, MIA PaCa-2, BxPC-3, PANC-1, CFPAC-1, Panc0403, HuPT-3, and SU86.86 cells were exposed to various concentrations of gemcitabine (GEM) for 72 h and cell viability was measured by the MTS assay. Data are shown as the mean ± SD from three biologically independent experiments (n = 3). b The protein expression of KRAS, TP53, CDKN2A, and SMAD4 in eight pancreatic cancer cell lines was analyzed by Western blot assay, and quantitative evaluation for each line was performed by using ImageJ software. The protein level of β-actin was used as the internal standard. Data are presented as the mean ± SD (n = 3 biologically independent experiments). c Differences in protein expression levels in AsPC-1 and MIA PaCa-2 cells. The protein expression of EGFR, HER2, SMAD2, SMAD3, SMAD4, SMAD7, and TGF-β was detected by Western blot analysis. Data are shown as the mean ± SD (n = 3 three biologically independent samples). ‘a’ indicates p < 0.05 as compared with AsPC-1 cells. p < 0.01 for TGF-β, p < 0.001 for SMAD4 and SMAD7. d Drug responses to either gemcitabine or DTLL between AsPC-1 and MIA PaCa-2 cells. AsPC-1 and MIA PaCa-2 cells were exposed to various concentrations of GEM or DTLL for 72 h and cell viability was measured by the MTS assay. The results were obtained from three biologically independent experiments. Data are presented as the mean ± SD (n = 3). ‘a’ indicates p < 0.05 as compared with GEM (AsPC-1 cells) and ‘b’ represents p < 0.05 compared with DTLL (AsPC-1 cells). p < 0.001 for comparison with GEM at the concentrations of 10−7, 10−6, 10−5 and 10−4mol/L, and p < 0.01 for comparison with GEM at the concentrations of 10−11, 10−9, 10−7 and 10−6 mol/L. e ROC (receiver operating characteristic) analysis to determine the SMAD4 expression level as a predictive tool for clinical gemcitabine response in pancreatic cancer patients (n = 108) from public data (TCGA-PAAD project). An ROC curve was plotted for AUC evaluation with the threshold level for SMAD4 expression at 2.27 (median expression of all the PAAD patients) to define the high (>2.27) or low (<2.27) level, followed with Fisher’s exact test for calculation of odds ratio and p-value. Note: For c and d, statistical significance was determined by using two-sided paired-samples t-test. All specific p values are presented in the Source Data file and only significant values are shown in figures. Source data are provided in the Source Data file.

