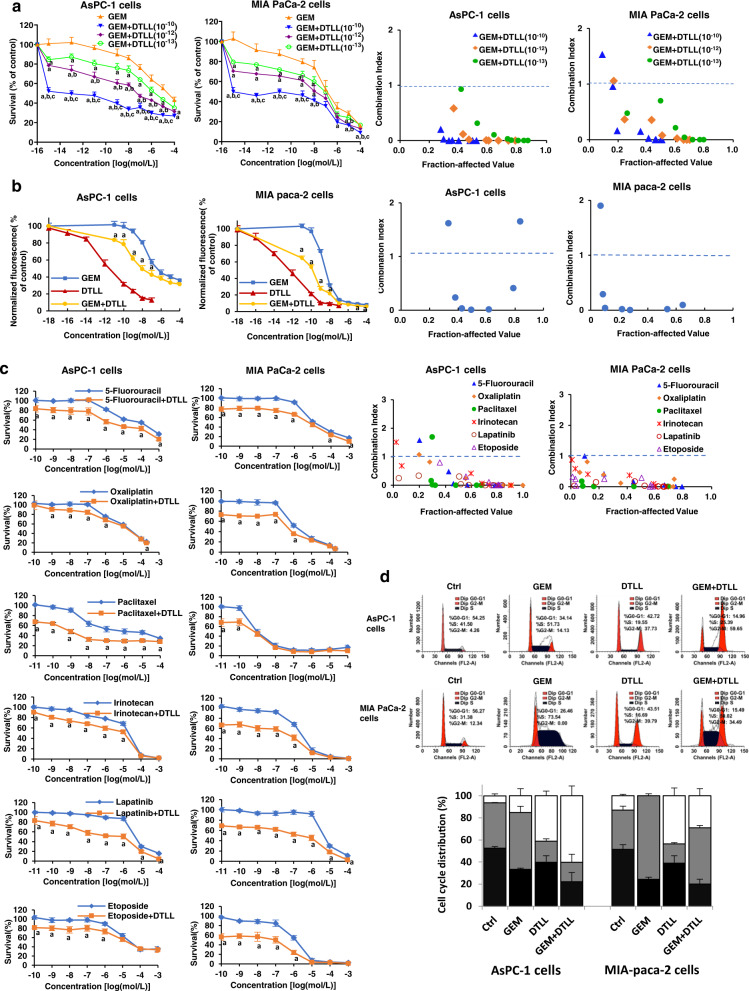
Fig. 2. DTLL potentiated proliferation inhibition and cell cycle arrest induced by gemcitabine.
a Effects on drug cytotoxicity in AsPC-1 and MIA-paca-2 cells after treatment with GEM, DTLL or both were detected by MTS assays. AsPC-1 and MIA PaCa-2 cells were exposed to a series of concentrations of GEM combined with 10−10, 10−12 and 10−13 mol/L DTLL for 72 h, respectively. The MTS assay was performed at the end of incubation. Data are shown as the mean ± SD (n = 3 biologically independent experiments). ‘a’ indicates p < 0.05 as compared with the GEM group, ‘b’, p < 0.05, compared with the ‘GEM + DTLL’(10−13) group, and’c’, p < 0.05, compared with the ‘GEM + DTLL’(10−12) group. b The inhibitory effect of GEM and DTLL on cell proliferation in AsPC-1 and MIA-paca-2 cells was measured based on DNA fluorescence using the CyQUANT proliferation assay. The cells were exposed to a series of concentrations of GEM, DTLL or GEM combined with 10−14 mol/L DTLL for 72 h, respectively. The assay utilizes a fluorescent dye to measure double strand DNA content with a microplate reader with excitation at 485 nm and emission detection at 530 nm. Data are shown as the mean ± SD (n = 3 biologically independent experiments). ‘a’ indicates p < 0.05, compared with the GEM group. c Synergistic effect of 5-fluorouracil, oxaliplatin, paclitaxel, irinotecan, lapatinib and etoposide with DTLL (10−12 mol/L) based on MTS assays. The synergistic effect of the combination treatment was evaluated by calculation of the combination index (CI) using the Chou-Talalay method. CI > 1, CI = 1 and CI < 1 indicate antagonistic, additive and synergistic effects, respectively. Data are shown as the mean ± SD (n = 3 biologically independent experiments). ‘a’ indicates p < 0.05, compared with the 5-fluorouracil, oxaliplatin, paclitaxel, irinotecan, lapatinib or etoposide group, respectively. d Cell cycle distribution in AsPC-1 and MIA paca-2 cells after treatment with GEM, DTLL or both was detected by flow cytometry assays. In the cell cycle assay, AsPC-1 and MIA PaCa-2 cells were treated with 0.02 µM gemcitabine, 0.1 nM DTLL or their combination for 24 h. The cell cycle distribution was evaluated using propidium iodide (PI) staining and analyzed by flow cytometry. Data are presented as the mean ± SD for biologically triplicate experiments. Note: One-way ANOVA with Bonferroni post hoc test was used in a. For b, c, statistical significance was determined by using two-sided paired-samples t-test. All specific p values are presented in the Source Data file and only significant values are shown in figures. Source data are provided in the Source Data file.

