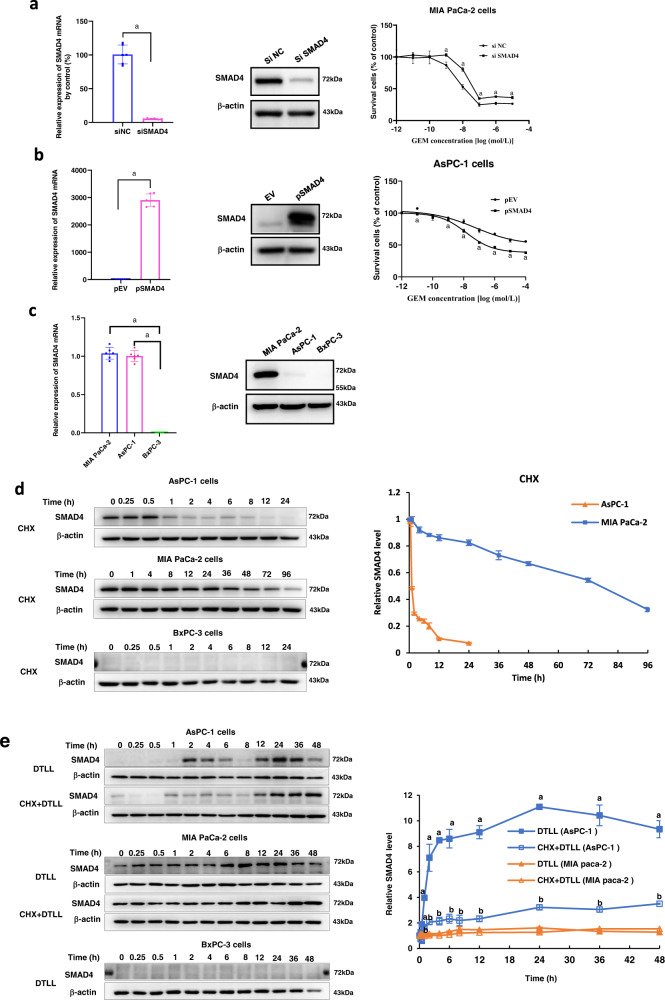
Fig. 4. Downregulation or upregulation of SMAD4 altered PDAC susceptibility to gemcitabine.
a Downregulation of SMAD4 reduced the sensitivity of MIA PaCa-2 cells to gemcitabine. After knocking down SMAD4 with its specific siRNAs, the mRNA and protein levels of SMAD4 were detected by qRT-PCR and Western blot assays. MIA PaCa-2 cells were exposed to various concentrations of GEM for 72 h and cell viability was measured by MTS assay. The results were obtained from three independent experiments. Data are presented as the mean ± SD (n = 3 biologically independent experiments). A pooled siRNA against SMAD4 (siSMAD4) and a scramble siRNA (siNC) indicate siRNA targeting SMAD4 and its negative control, respectively. ‘a’ indicates, p < 0.05, as compared with the control. p = 1.26 × 10⁻⁸ in qRT-PCR assay, and p < 0.001 at the GEM concentration of 10−8 mol/L in MTS assay. b Upregulation of SMAD4 increased the sensitivity of AsPC-1 cells to gemcitabine. After SMAD4 was upregulated by its overexpression vector, the mRNA and protein levels of SMAD4 in AsPC-1 cells were detected by qRT-PCR and Western blot assays. The AsPC-1 cell line was exposed to various concentrations of GEM for 72 h, and cell viability was measured by the MTS assay. The results were obtained from three independent experiments. Data are presented as the mean ± SD (n = 3 biologically independent experiments). pSMAD4 and pEV indicate SMAD4 overexpression plasmid and its empty vector, respectively. ‘a’ indicates p < 0.05 as compared with the control. p = 2.42 × 10⁻¹¹ in qRT-PCR assay. In MTS assay, p ≤ 0.001 (pSMAD4 versus pEV) at the concentrations of 10−11, 10−7, 10−6, 10−5, and 10−4 mol/L. c The differences in SMAD4 mRNA expression and protein levels in BxPC-3 (SMAD4 deletion), MIA PaCa-2 (wild-type SMAD4) and AsPC-1 (mutant SMAD4) cells. Data are shown as the mean ± SD from three biologically independent samples (n = 3). ‘a’ indicates p < 0.05 as compared to BxPC-3 cells with p = 2.79 × 10⁻¹⁴ for AsPC-1 and 4.67 × 10⁻¹⁴ for MIA PaCa-2 cells. d The protein levels and half-life times of wild-type and mutant SMAD4 in AsPC-1, MIA PaCa-2 and BxPC-3 cells. Data presented are the mean ± SD from three biologically independent samples (n = 3). e The protein levels of SMAD4 with DTLL induction in AsPC-1, MIA PaCa-2 and BxPC-3 cells. Data are shown as the mean ± SD from three biologically independent samples (n = 3). ‘a’ indicates p < 0.05 with comparison of DTLL (AsPC-1) versus DTLL (MIA PaCa-2 cells) and ‘b’ represents p < 0.05 with comparison of CHX + DTLL (AsPC-1) versus CHX + DTLL (MIA PaCa-2 cells). When treated with DTLL, p < 0.001 for all time points except for 0, 0.25 and 0.5 h; When treated with CHX + DTLL, p < 0.001 for 1, 24, 36, and 48 h. Note: All specific p values are presented in the Source Data file and only significant values are shown in figures. For a, b, e, statistical significance was determined by using two-sided Paired-samples t-test. One-way ANOVA with Bonferroni post hoc test was used in c. Source data are provided in the Source Data file.

