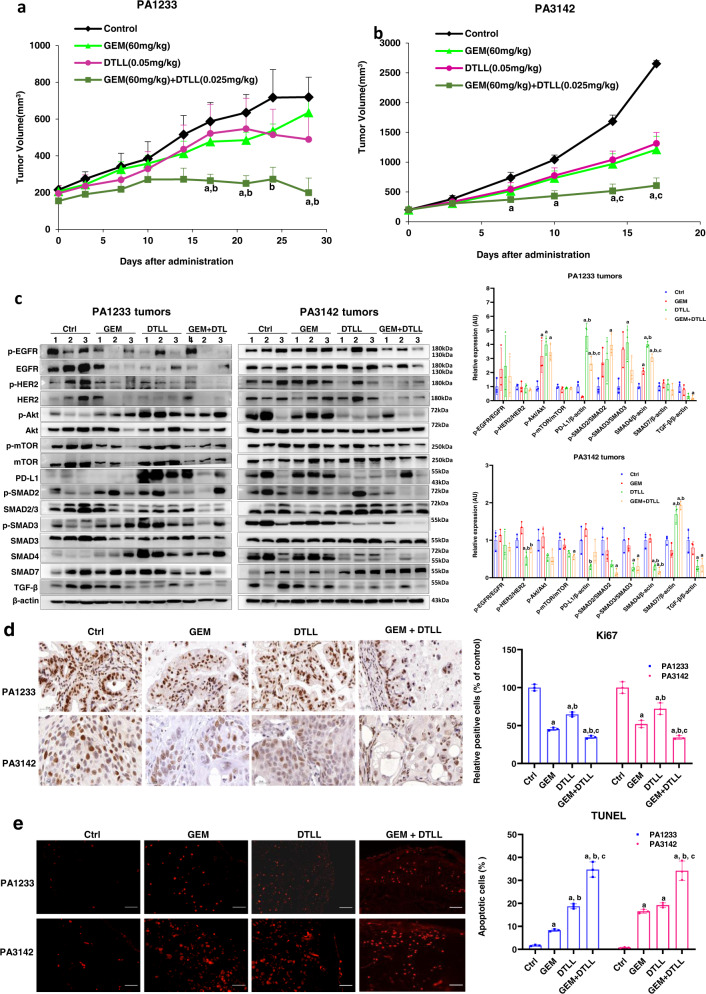
Fig. 6. Evaluation of in vivo efficacy by patient-derived xenograft (PDX) models of human pancreatic cancer.
Inhibitory effect of gemcitabine, DTLL and both in two PDX models of PA1233 (a) and PA3142 (b) on tumor growth. In both PDX models, the mice were received equal volumes of physiological saline (control group), 60 mg/kg gemcitabine every four days (GEM group), 0.05 mg/kg DTLL once a week (DTLL group) and 60 mg/kg gemcitabine combined with 0.025 mg/kg DTLL (GEM + DTLL group). Data are representative of biologically independent replicates as the mean ± SEM (n = 3 for PA1233 and n = 4 for PA3142 tumors). In PA3142 model, p < 0.001 (‘GEM + DTLL’versus Control) for day 14 and 17. c Protein expression levels in tumor tissue samples from PA1233 or PA3142 models after treatments with GEM, DTLL or both were determined by Western blot assays. Band intensities were quantified using Image J. Data are displayed as the mean ± SD (n = 3 biologically independent replicates). In PA1233 PDX model, p < 0.001 for PD-L1 between DTLL versus Control or DTLL versus GEM; p < 0.001 for SMAD4 between ‘GEM + DTLL’ versus Control, DTLL versus Control or DTLL versus GEM. In PA3142 PDX model, p < 0.001 for SMAD4 between ‘GEM + DTLL’ versus Control, ‘GEM + DTLL’ versus GEM, DTLL versus Control or DTLL versus GEM; p < 0.001 for SMAD7 between ‘GEM + DTLL’ versus Control, ‘GEM + DTLL’ versus GEM or DTLL versus GEM. d IHC staining of Ki-67 in paraffin-embedded tumor tissue samples from either the PA1233 or PA3142 models (×100). Tumor sections were deparaffinized, rehydrated and incubated with Ki-67 antibody, followed by incubation with secondary antibody. The results were observed by an inverted microscope using DAB as a chromogenic reagent. Images are representative of three biologically independent replicates with a scale bar representing 50 μm (n = 3). In either PA1233 or PA3142 tumors, p < 0.001 between ‘GEM + DTLL’ versus Control, ‘GEM + DTLL’ versus DTLL or GEM versus Control. In PA1233 tumors, p < 0.001 between DTLL versus Control or DTLL versus GEM. e Apoptosis in the PA1233 and PA3142 models was measured in TUNEL assay (×200). Apoptotic cells in tumor tissue were determined by the TUNEL method according to the manufacturer’s instructions. They were observed and photographed under a fluorescence microscope. Red fluorescence represents the positive cells. Images are representative of biologically independent replicates with a scale bar representing 25 μm (n = 3). In either PA1233 or PA3142 tumors, p < 0.001 between ‘GEM + DTLL’ versus Control, ‘GEM + DTLL’ versus GEM, ‘GEM + DTLL’ versus DTLL or DTLL versus Control. In PA1233 tumors, p < 0.001 between DTLL versus GEM. In PA3142 tumors, p < 0.001 between GEM versus Control. Note: For a–e, ‘a’ indicates p < 0.05 as compared with the control, ‘b’, p < 0.05 compared with the GEM group and ‘c’, p < 0.05 compared with the DTLL group. All specific p values are presented in the Source Data file and only significant values are shown in figures. For a–b, statistical significance was determined by using paired-samples t-test was two-sided. For c–e, statistical significance was determined by using one-way ANOVA with Bonferroni post hoc test. Source data are provided in the Source Data file.

