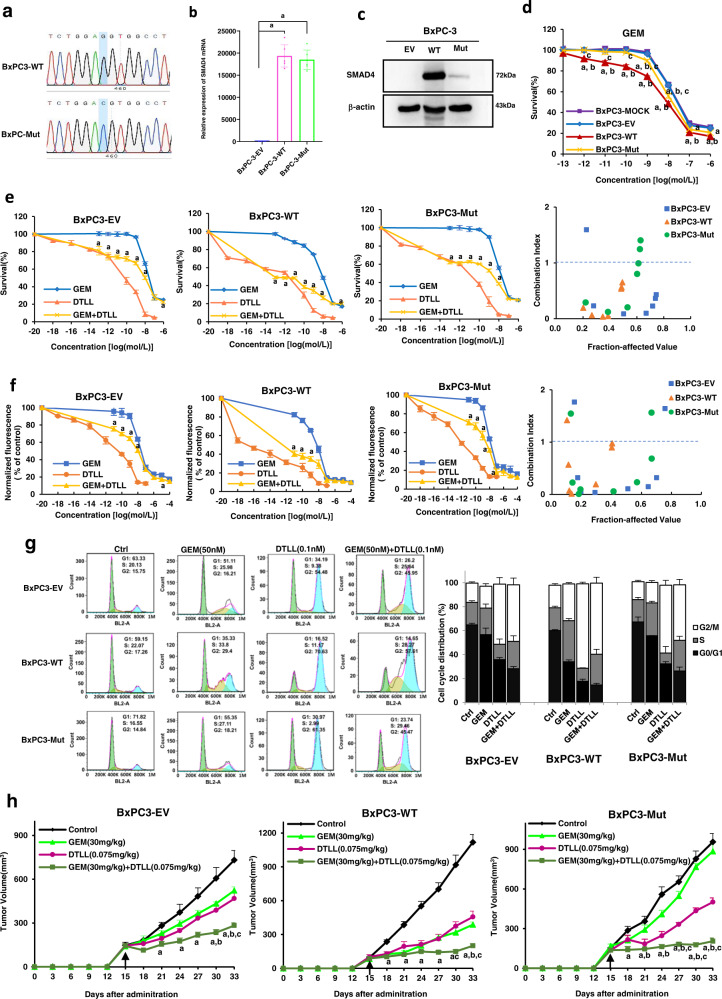
Fig. 7. Evaluation of gemcitabine efficacy in BxPC-3 cells stably expressing wild-type and mutant SMAD4 in vitro and in vivo.
a Sequence of wild-type Smad4 and mutant Smad4 R100T constructs. b Real-time qRT-PCR analysis of the mRNA level of SMAD4 in BxPC3-EV, BxPC3-WT and BxPC3-Mut stably transfected cells. BxPC3-EV, BxPC3-WT and BxPC3-Mut indicate that BxPC3 cells were stably transfected with the empty vector, wild-type SMAD4 or mutant SMAD4 (R100T) overexpression vectors. Data are shown as the mean ± SD from three biologically independent samples (n = 3). ‘a’ indicates p < 0.001 as compared with BxPC3-EV with p = 1.38 × 10⁻¹⁰ for BxPC3-Mut and 7.24 × 10⁻¹¹ for BxPC3-WT cells. c Western blot analysis of SMAD4 in BxPC3-EV, BxPC3-WT and BxPC3-Mut stably transfected cells. The results were obtained from three biologically independent experiments as the mean ± SD (n = 3). d Effects of overexpression of wild type and mutant SMAD4 on the sensitivity of BxPC-3 cell lines to gemcitabine. The BxPC-3 cell line was exposed to various concentrations of GEM for 72 h and cell viability was measured by the MTS assay. Data are shown as the mean ± SD from three biologically independent replicates (n = 3). ‘a’ indicates p < 0.05, compared with BxPC3-MOCK; b p < 0.05, compared with the BxPC3-EV; c p < 0.05, compared with the BxPC3-WT. In BxPC3-WT cells, p < 0.001 for 10−10, 10−9 and 10−8 mol/L of GEM as compared to either BxPC3-MOCK or BxPC3-EV; and p < 0.001 at 10−6 mol/L as compared to BxPC3-MOCK. In BxPC3- Mut cells, p < 0.001 at 10−8 mol/L of GEM as compared to BxPC3-MOCK. e Effects on drug cytotoxicity in BxPC3-EV, BxPC3-WT and BxPC3-Mut stably transfected cells after treatment with GEM, DTLL or GEM combined with 10−14 mol/L DTLL were detected by MTS assays. Data are shown as the mean ± SD from three biologically independent replicates (n = 3). ‘a’ indicates p < 0.05 as compared with the GEM group. In BxPC3-EV cells, p < 0.001 at 10−12, 10−11, 10−10, 10−9 and 10−8 mol/L of GEM between ‘GEM + DTLL’ versus GEM. In either BxPC3-WT or BxPC3-Mut cells, p < 0.001 between ‘GEM + DTLL’ versus GEM at all concentrations of GEM except for 10−7 and 10−6 mol/L of GEM. f The inhibitory effect of GEM and DTLL on cell proliferation in BxPC3-EV, BxPC3-WT and BxPC3-Mut stably transfected cells was measured by a CyQuant proliferation assay. The cells were exposed to a series of concentrations of GEM, DTLL or GEM combined with 10−14 mol/L DTLL for 72 h, respectively. Data are shown as the mean ± SD from three biologically independent replicates (n = 3). As compared ‘GEM + DTLL’ to GEM, p < 0.001 for 10−9 mol/L of GEM in BxPC3-EV cells, p < 0.001 at 10−13 mol/L in BxPC3-WT cells, and p < 0.001 at 10−11, 10−12 and 10−13 mol/L in BxPC3-Mut cells. g Cell cycle distribution in BxPC3-EV, BxPC3-WT and BxPC3-Mut stably transfected cells after treated with GEM, DTLL or both was detected by flow cytometry assays. Cells were treated with 0.005 µM gemcitabine, 0.1 nM DTLL or their combination for 24 h. The cell cycle distribution was evaluated using propidium iodide (PI) staining and analyzed by flow cytometry. Data are representative of biologically independent triplicates (n = 3). h Inhibitory effect on tumor growth of treatments with gemcitabine, DTLL and both in these three CDX models derived from BxPC3-EV, BxPC3-WT and BxPC3-Mut cells. In those models, the mice received an equal volume of physiological saline (control group), 30 mg/kg gemcitabine intraperitoneally administered every four days (GEM group), 0.075 mg/kg DTLL at the LDM-equivalent dose intravenously administered once a week (DTLL group) and 30 mg/kg gemcitabine combined with 0.075 mg/kg DTLL (‘GEM + DTLL’group). Data are presented as the mean ± SEM for biologically independent replicates as the mean ± SD (n = 5). In BxPC3-EV CDX model, p < 0.001 (‘GEM + DTLL’versus Control) for day 27, 30 and 33. In BxPC3-WT CDX model, p < 0.001 (‘GEM + DTLL’versus Control) for day 21, 24, 27, 30, and 33. In BxPC3- Mut CDX model, p < 0.001 (‘GEM + DTLL’ versus Control) for day 24, 27, 30, and 33; p < 0.001 (‘GEM + DTLL’ versus GEM) for day 27, 30, and 33; p < 0.001 (‘GEM + DTLL’versus DTLL) for day 30. One-way ANOVA with Bonferroni post hoc test was used in b, d, h; Paired-samples t-test was two-sided and used in e and f. All specific p values are presented in the Source Data file and only significant values are shown in figures. Source data are provided in the Source Data file.

