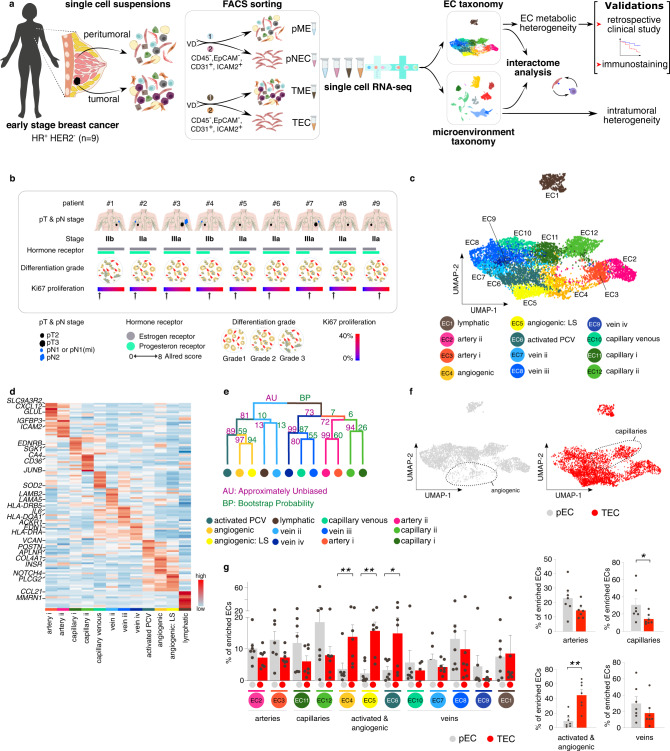
Fig. 1. Single cell taxonomy of endothelial cells in the breast.
a Study design. EC endothelial cell, HR hormone receptor, HER2 human epidermal growth factor receptor 2, VD Viability Dye, pME peri-tumoral microenvironment, pEC peri-tumoral endothelial cells, TME tumor microenvironment, TEC tumor endothelial cells. The numbers related to FACS-sorting indicate sequence of sorting, color coded to indicate that each patient yields 4 samples (pME, pEC, TME, and TEC). b Patient characteristics. First line, patient identifier; second line, pathological tumor (pT) and nodal (pN) stage; third line, IUCC (International Union for Cancer Control) cancer stage according to the 8th edition; fourth line, hormone receptor status, coded by color for receptor type (gray, estrogen receptor; green, progesterone receptor) and bar length for Allred score (routinely used immunohistochemistry score based on the percentage of positive cells and the intensity of that staining); fifth line, differentiation grades; grade 1, well differentiated; grade 2, moderately differentiated (patient: #2–8); grade 3, poorly differentiated (patient: #1); sixth line, Ki67 proliferation index based on the clinically performed immunohistochemistry stainings. c UMAP-plot, showing the subclustering of 8433 endothelial cells (ECs) from tumoral (n = 8) and matched peri-tumoral (n = 7) breast cancer (BC) patients. LS lower sequencing depth, PCV post-capillary venules. d Heatmap of the expression levels of the top-10 marker genes in all EC subclusters. Color scale: red – high expression, blue – low expression. e Hierarchical clustering analysis of EC subclusters. Color differences in the dendrogram indicate clusters that were resolved by multiscale bootstrapping, p-value cutoff 0.4. Approximately unbiased (AU) p-values, and bootstrap probability (BP) values are indicated for each dendrogram branch in purple and green, respectively. f UMAP-plots of all 8433 ECs color-coded by condition. Dotted lines surround angiogenic (left) and capillary (right) EC subclusters. g Abundances of EC subclusters across conditions (pEC (gray), TEC (red)). Left panel: y-axis depicts % of total enriched ECs, x-axis depicts EC subtypes color coded as in panel (c). Right panels: similar representation of the data as in left panel, but EC subtypes were pooled as indicated. Data are mean ± SEM, n = 7 for pEC, n = 8 for TEC, *p < 0.05, **p < 0.01 (exact p-values = 0.008, 0.0063, 0.0498, respectively (left panel), and 0.0151, 0.0021, respectively (right panel)), paired t-test (two-tailed) per subcluster (taking only into account the 7 complete pairs).

