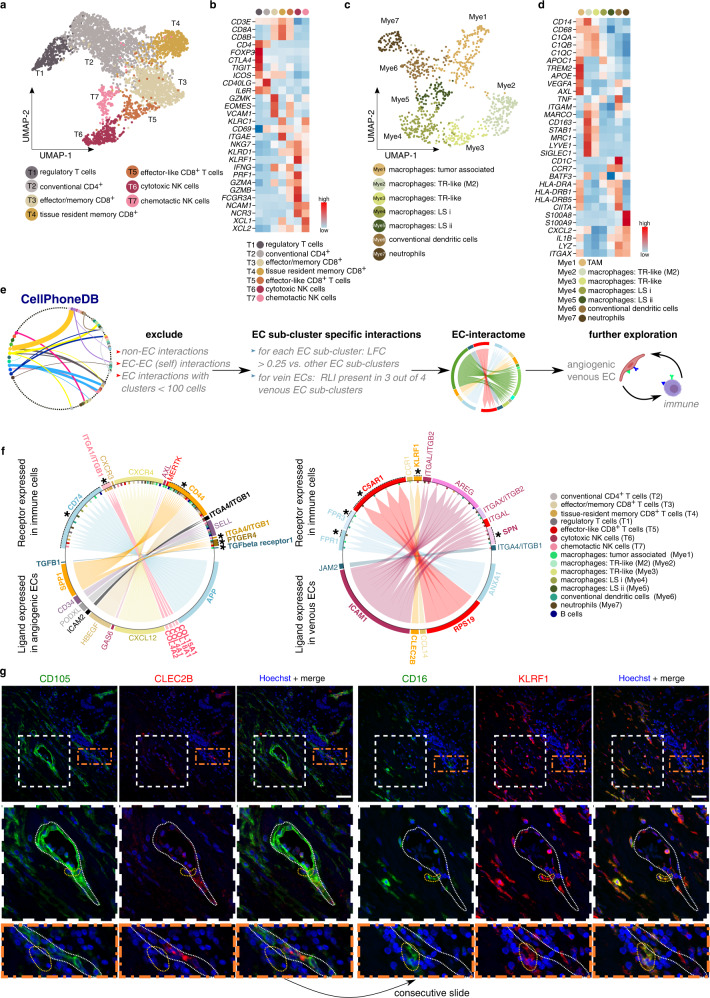
Fig. 4. Immune cell subclustering and EC-immune cell interactome predictions.
a UMAP-plot of T-/NK cells color coded by subcluster. NK natural killer. b Heatmap of the expression levels of canonical marker genes of T-/NK cell (sub-)types. Color scale: red – high expression, blue – low expression. c UMAP-plot of myeloid cells color coded by subcluster. TR tissue resident, LS lower sequencing depth. d Heatmap of the expression levels of canonical genes in myeloid cells. Color scale: red – high expression, blue – low expression. TAM tumor associated macrophages. e Schematic overview of the receptor ligand interaction analysis. Clusters containing <100 cells: mast cells, plasma cells and plasmacytoid dendritic cells. EC endothelial cell, LFC log fold change, RLI receptor ligand interaction. f Circos plots representing RLI analysis between angiogenic/venous ECs and immune cells. Receptor is expressed on immune cell subclusters, ligand is expressed on angiogenic ECs (left panel) or venous ECs (right panel). Plots are color coded for the receptor–ligand pairs (arrows, gene names) and immune cell subclusters expressing the receptor (bars perpendicular to inner circle). Previously unknown RLI pairs between ECs and specific immune cell subtypes are indicated in bold (genes) and with asterisks (subclusters). g Representative micrographs of human breast tumoral tissue sections, immunostained for CD105 and CLEC2B (left panels) or CD16 and KLRF1 (right panels) and counterstained with Hoechst (n = 8). Middle panels: magnifications of the white boxed areas in the upper panels. Bottom panels: magnifications of the orange boxed areas in the upper panels. Dotted white line indicates a CLEC2B+ blood vessel, dotted orange lines indicate KLRF1+ NK cells in the vicinity of the blood vessel. Scale bar: 50 µm.

