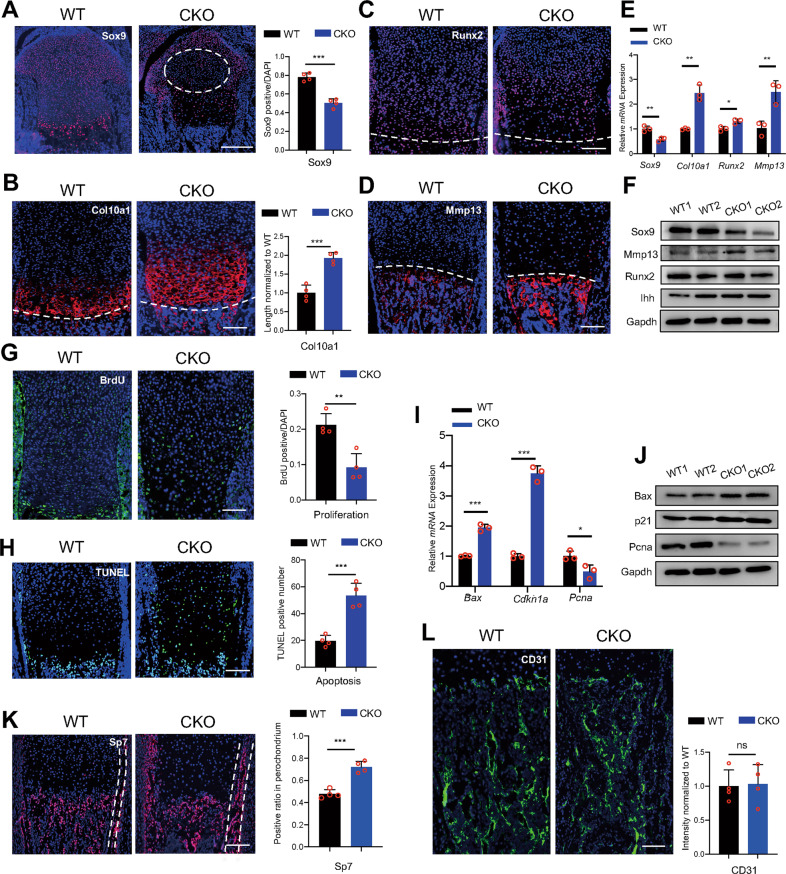
Fig. 2. Loss of Hnrnpk results in damaged survival and premature differentiation of growth plate chondrocytes.
A Immunostaining of Sox9 of tibia of E18.5 WT and CKO embryos (left panel) and the quantification of Sox9 positive cells (right panel). Dotted circle: region contained atypical chondrocytes. n = 4 biological replicates. Scale bar: 100 μm. B Immunostaining of Col10a1 of tibia of E18.5 WT and CKO embryos (left panel) and measurement of Col10a1 positive range (right panel). Dotted lines: boundary between hypertrophic zone and POC. n = 4 biological replicates. Scale bar: 100 μm. C, D Immunostaining of Runx2 (C) and Mmp13 (D) of tibia of E18.5 WT and CKO embryos. Dotted lines: boundary between hypertrophic zone and POC. Scale bar: 100 μm. E mRNA expression level of Sox9, Col10a1, Mmp13, and Runx2 of E18.5 WT and CKO growth plate cartilage. n = 3 biological replicates. F Protein level of Sox9, Mmp13, Runx2, and Ihh of E18.5 WT and CKO growth plate cartilage. G, H BrdU assay (G) and TUNEL assay (H) of tibia of E18.5 WT and CKO embryos (left panel) and the quantification of BrdU and TUNEL positive cells (right panel). n = 4 biological replicates. Scale bar: 100 μm. I mRNA expression level of Bax, Cdkn1a, and Pcna of E18.5 WT and CKO growth plate cartilage. n = 3 biological replicates. J Protein level of Bax, p21, and Pcna of E18.5 WT and CKO growth plate cartilage. K, L Immunostaining of Sp7 (K) and CD31 (L) in POC of tibia from E18.5 WT and CKO embryos (left panel) and the quantification of Sp7 and CD31 staining (right panel). Dotted lines: perichondrium. n = 4 biological replicates. Scale bar: 100 μm. p-value was calculated by two-tailed unpaired Student’s t-test. Data were shown as mean ± SD. *p < 0.05; **p < 0.01; ***p < 0.001; ns: not significant.

