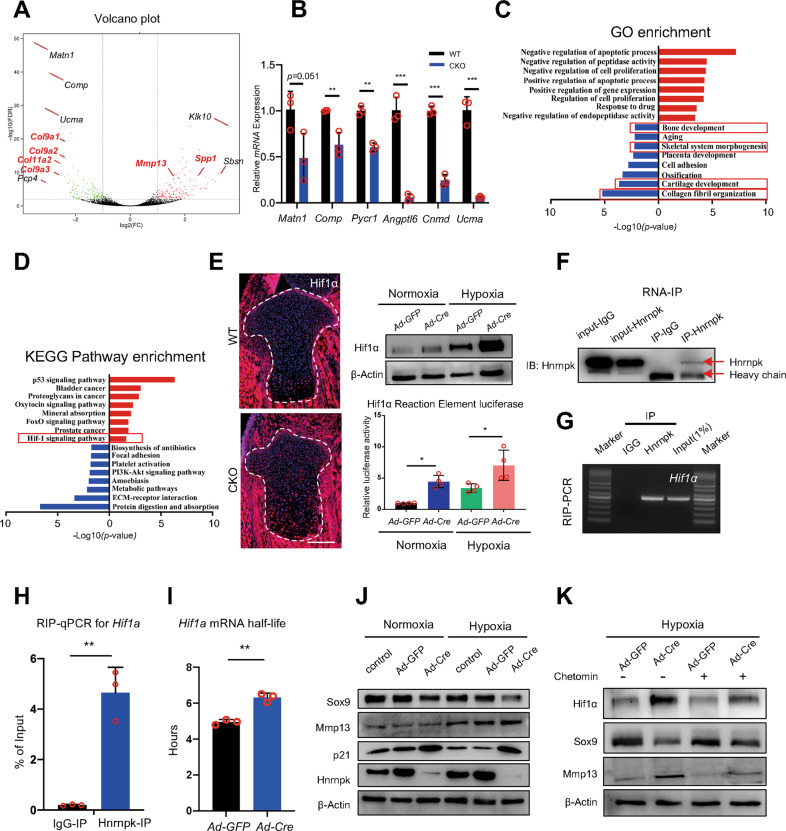
Fig. 4. Elevated activity of Hif-1 signaling pathway in CKO growth plate chondrocytes.
A Volcano plot of RNA-seq. B mRNA expression level of significantly downregulated genes (Matn1, Comp, Pycr1, Angptl6, Cnmd, and Ucma) in E18.5 CKO growth plate cartilage compared to WT. n = 3 biological replicates. C, D GO enrichment analysis (C) and KEGG pathway enrichment analysis (D) of up- and down-regulated genes (Log2FC > 1 or < -1, p-value < 0.05) according to RNA-seq results. Red boxes: items we focus on. E The expression of Hif1α of tibia of E18.5 WT and CKO embryos (left panel), and protein level of Hif1α (right panel, top) and the luciferase activity (right panel, bottom) of Hnrnpkfl/fl chondrocytes infected with Ad-GFP or Ad-Cre under normoxic or hypoxic conditions. n = 4 biological replicates. Scale bar: 100 μm. F Hnrnpk protein level of supernatant immunoprecipitated with antibodies of Hnrnpk or IgG. G, H RIP-PCR (G) and RIP-qPCR (H) were used to determine the level of binding between Hnrnpk and Hif1a mRNA. IgG IP was used as a specificity control. n = 3 biological replicates. I Half-life of Hif1a mRNA of Hnrnpkfl/fl chondrocytes infected with Ad-GFP or Ad-Cre. n = 3 biological replicates. J Protein level of Sox9, Mmp13, p21, and Hnrnpk of Hnrnpkfl/fl chondrocytes infected with Ad-GFP or Ad-Cre under normoxic or hypoxic conditions. K Protein level of Hif1α, Sox9, and Mmp13 in Hnrnpkfl/fl chondrocytes treated with DMSO or Chetomin after being infected with Ad-GFP or Ad-Cre under hypoxic condition. p-value was calculated by one-way ANOVA followed by Tukey’s multiple comparisons tests (E) or two-tailed unpaired Student’s t-test (B, H, I). Data were shown as mean ± SD. *p < 0.05; **p < 0.01; ***p < 0.001.

