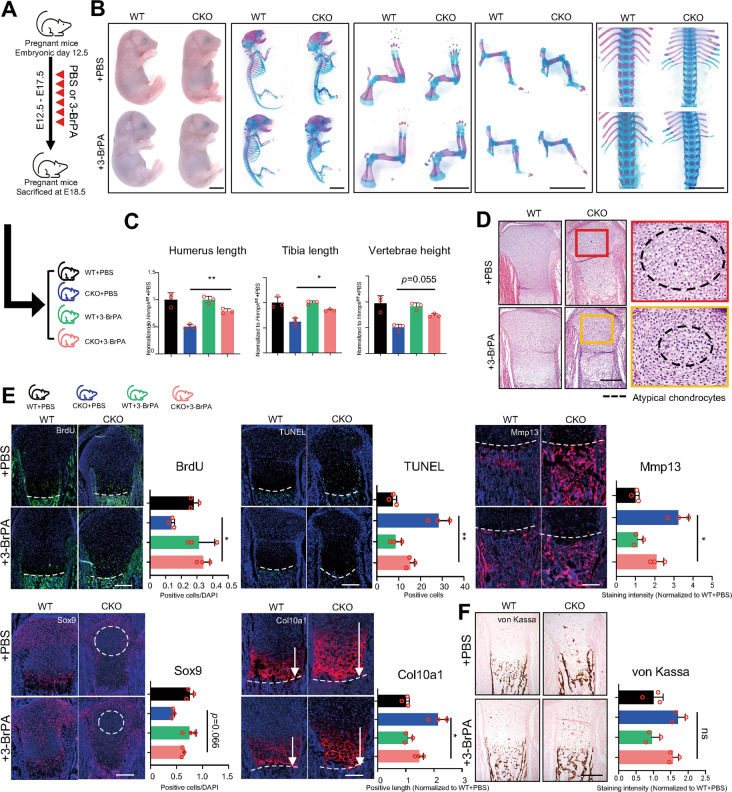
Fig. 6. Suppressing glycolytic intensity partially rescues dwarfism phenotype in CKO embryos in vivo.
A Diagram of strategy about intraperitoneal injection of PBS or 3-BrPA and corresponding possible offspring. B General inspection and skeletal preparation of E18.5 embryos delivered from pregnant mice injected with PBS or 3-BrPA. Scale bar: 1 mm. C Quantification of humerus length (left panel), tibia length (middle panel), and vertebrae height (right panel) according to skeletal preparation of E18.5 embryos delivered from pregnant mice injected with PBS or 3-BrPA. Statistical analysis was exerted between CKO + PBS and CKO + 3-BrPA groups. n = 3 biological replicates. D H&E staining of tibia of E18.5 embryos delivered from pregnant mice injected with PBS or 3-BrPA. Boxes: magnification of resting zone in growth plate. Dotted circles: the area where atypical chondrocytes exist. Scale bar: 100 μm. E Immunostaining of BrdU assay, TUNEL assay, Sox9, Col10a1, and Mmp13 of tibia of E18.5 embryos delivered from pregnant mice injected with PBS or 3-BrPA and corresponding quantitative analysis. Statistical analysis was exerted upon CKO + PBS and CKO + 3-BrPA groups. Dotted lines: boundary between hypertrophic zone and POC. Dotted circles: the area where atypical chondrocytes exist. White arrows: positive range of Col10a1. n = 3 biological replicates. Scale bar: 100 μm. F von Kassa staining of tibia of E18.5 embryos delivered from pregnant mice injected with PBS or 3-BrPA and quantitative analysis. n = 3 biological replicates. Scale bar: 100 μm. p-value was calculated by one-way ANOVA followed by Tukey’s multiple comparisons tests. Data were shown as mean ± SD. *p < 0.05; **p < 0.01; ***p < 0.001; ns: not significant.

