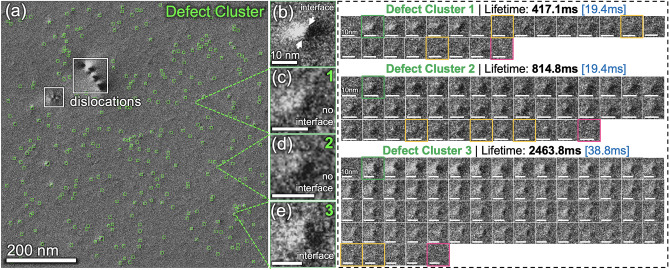
Figure 1.
Representative defect clusters in a snapshot of an in-situ TEM video acquired during 1 MeV Kr2+ ions irradiation of a pure nickel at 700 °C. (a) An in-situ TEM image frame with 320 defect clusters (green boxes) and dislocations (white boxes). (b–e) Individual defect clusters exhibit different contrasts and representations. (right). In-situ TEM image series of three selected defect clusters with different lifetimes. The time interval between frames marks in blue. In these sequences, the green outlined frames indicate when a defect cluster became visible; the red frames outline its annihilated, and the yellow frames mark when the defect clusters suddenly appear to be indistinguishable from the background.

