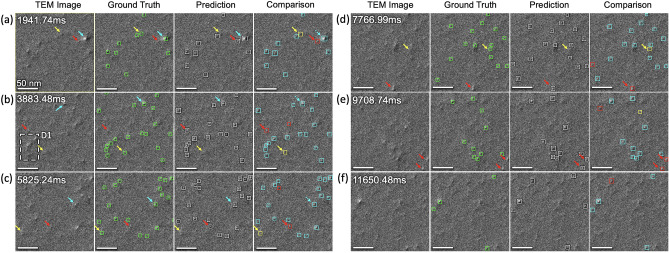
Figure 5.
DefectTrack’s standalone detector performance. (a–f) Examples of the detector performance visualized in selected in-situ TEM video frames with color-coded confusion box-map comparison: true positive (turquoise), false positive (red), and false negative (yellow). Detection is presented here at video frames with a time interval of 1941.7 ms. Turquoise arrows indicate defect clusters with high detection confidence. Yellow arrows mark representative defect clusters with considerably weak contrast and are occasionally missed by the detector. Red arrows mark the misidentified defect clusters.

